Generating control limits using Control Chart Builder
I create a control chart, describe how the control limits are calculated and discuss how these limits can be used to make decisions.

What is the probability that we can detect non-negligible effects given a specified model?
Ryan_Lekivetz
This post goes into more detail about specification limits.
After talking to customers when I worked in Technical Support and more recently at JMP Discovery Summit conferences and site visits, I realized that there is confusion about the difference between control limits and specification limits. While you may have heard of, or even used both of these in your work, they are quite different from each other. In this blog post, I will explain those difference...
This article appears in JMPer Cable, Issue 30, Summer 2015. by Di Michelson di.michelson, Senior Analytical Training Consultant, SAS Mark Bailey wrote an excellent article in Issue 29 of the JMPer Cable, detailing how to use data below a limit of detection. What do you do when you need to estimate that threshold of measurement? Analytical chemistry provides information about the concentration ...
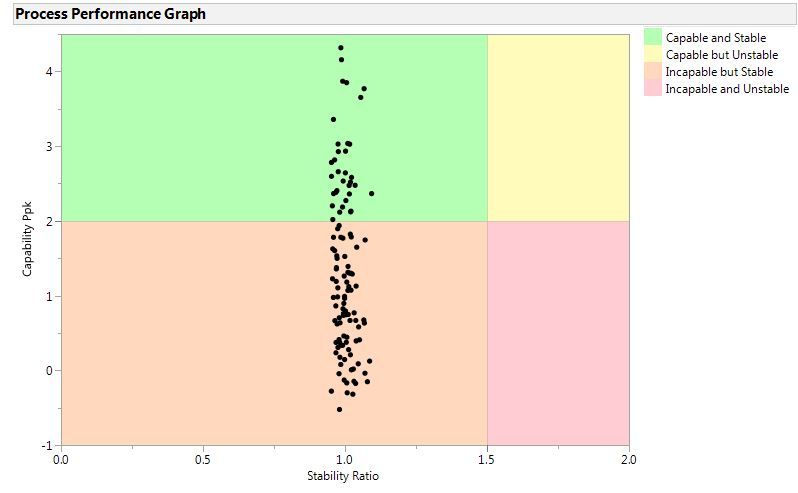
Process Performance GraphWouldn’t it be wonderful to be able to determine capability and stability on thousands of processes in a single graph?
This article originally appeared in JMPer Cable, Issue 26, Winter 2010by Joseph Morgan joseph.morgan, JMP Senior Software Developer, SASNote: The JSL in this article is compatible with JMP 9 and later. Accordingly, the code may not reflect the power of JSL introduced with versions of JMP released subsequent to JMP 9.
IntroductionMany beginning and intermediate JMP Scripting Language (JSL) program...
Montgomery County, Maryland, publishes all traffic violations since 2013, now totaling more than 780,000 incidents. Besides the location and details of the violations, the table also contains information about the vehicles involved, such as make, model, year and color. It’s car colors that I want to explore here.Even though the violations go back only to 2013, the model year of the cars goes back ...
A baby sea turtle that has just hatchedI spend a fair amount of time at the North Carolina coast, specifically at Oak Island. Over the years, I’ve noticed the attention given to saving the sea turtles, but I didn’t get involved with this endeavor until the summer of 2014.I happened to witness a nest hatching with my mom one evening, and it was amazing to watch all those tiny turtles emerge and ma...
When I was growing up in the Midwest (Columbia, MO, to be precise), flavored potato chips were a favorite of mine. Though I preferred sour cream and onion, barbecue would do in a pinch. Imagine my delight, then, when my colleague Ryan Lekivetz informed me that our neighbors to the North had an entire new range of chip flavors to try!And imagine my disappointment when I found out that two of the mo...
Each taster in the choice experiment got a set of potato chips like this. Can you guess which one is the ketchup-flavored chip?I grew up in Canada, where ketchup potato chips were a staple at most children's birthday parties. As a huge fan of these ketchup chips, I was unsure whether my enjoyment of the wonderful flavor was simply nostalgia and whether other people unfamiliar with the flavor woul...
Ryan_Lekivetz
My father and I have collected and customized diecast cars for the past 15 years. But lately, dyeing the cars has become a challenge. (Photos courtesy of Caroll Co)With Father’s Day fast approaching, it seemed fitting that I should share a story about a father and son bonding over design of experiments (DOE) and toy cars. Full disclosure: Some (including their wives) think both the father and son...
Ryan_Lekivetz
Today I mourn the passing of George Box, truly a giant among 20th century statisticians. Indeed, I should not relegate him to the 20th century because he won the Brumbaugh Award in 2010 and 2007 for writing papers that made in their year of publication the largest single contribution to the development of industrial application of quality control.Professor Box was 93. The last time I saw him was a...
It is fairly common that experiments run in a time sequence experience linear drift in the response over the course of the experiment. If you randomize the order of the runs, then the effect of this drift will not tend to bias the estimated factor effects, but it will increase the variance of those effects.Is there a better choice than random run order?I would usually advise investigators to rando...
When I was at the JMP Discovery Summit last year, several people asked me, “What’s a three-way chart and why would I need one?” Not everyone needs one, but some might. In this blog post, I’ll tell you more about them and why you might want to use them.The Centers of Disease Control (CDC) is advising all adolescent girls, and more recently, adolescent boys to receive the full three-dose sequence fo...
Many years ago, we added the Presummarized control charts to JMP version 5 at the request of folks in the semiconductor industry. While there are many types of Presummarized control charts, one of the most common is the chart called, “Individuals on Group Means,” which plots the subgroup average just like an XBar chart, but uses the overall moving range between each consecutive average for sigma w...
In my first Control Chart Builder blog post “Control Charts are easy in JMP 10,” I used a column named “Date” on the X-axis. When I downloaded the data, it didn’t arrive as a date; I had to create the date column from the original month and year columns. Traditionally, when you had more than one variable or column of interest on an axis, you needed to create a new variable with a formula similar t...
In my last blog post, I noted that the Control Chart Builder is an overhaul of the older Control Chart platform. One of the most requested features for Control Charts was to offer a way to customize the tests that flag out-of-control samples. I’m happy to report that the new Control Chart Builder platform in JMP 10 has an option to customize the tests – plus you can save the customization to your ...
JMP 10 introduces a snazzy way to create control charts with a new platform called Control Chart Builder. JMP's prior Control Charts were designed over two decades ago for the classic process engineer in manufacturing and were past due for an overhaul.The more we listened to which customers were running control charts and how they were using them, the more I was surprised to learn that people fro...