Don’t miss your chance to experience Discovery Summit Europe at our best available rate! Early bird registration through 31 Oct.
Graph Builder Toolbar streamlines interactive graphing. Creates shortcuts on Report and GraphBuilder Helpers toolbars. Download and install the extension.
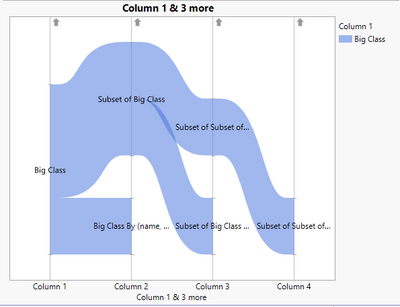
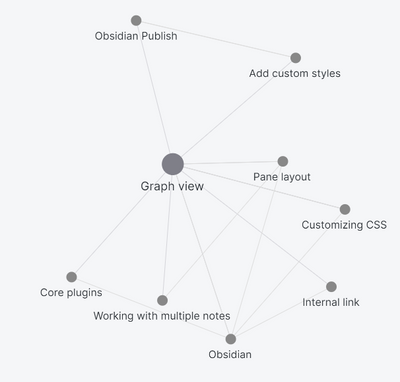
I would like to have an interface which I could use to check different relations between different datatables and reports generated from them. This would help user to track how different data tables and visualisations might be related and possibly also help to visualise the flow needed to reach the end. Of course it would be nice to able to also something from this interface (bring table / table to top for example). This would require JMP to save the relations somewhere, so this should maybe be an option in Preferences.
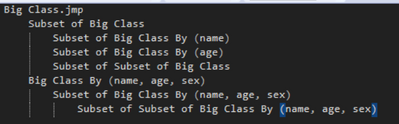
Some example ideas (most likely there are way better visualizations for this):
Lazyu example script for parallel and ishikawa. Using something like this would work, but you would have to have your own functions/class to handle subsetting and so on, to get all references. You can also parse some names and link them back (subset and summary).