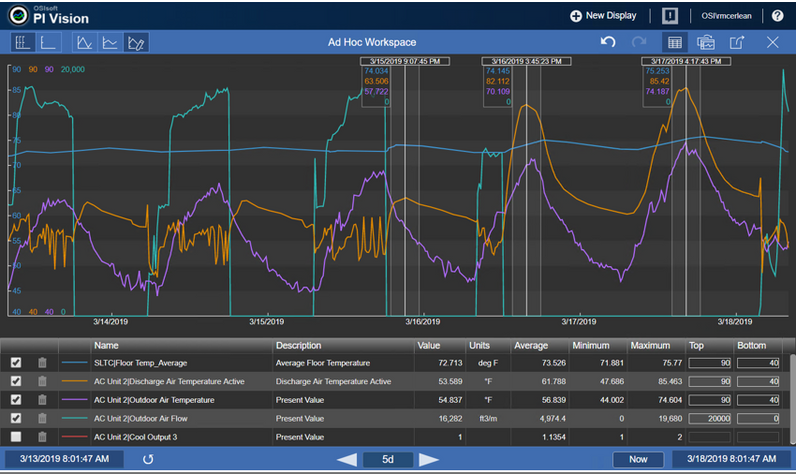
The GraphBuilder can be used to visualize sensor data as Y's and a DateTime as X to make trends.
However, when Y's have different units or scales, the only way is to pre-standardize the columns and plot them all together.
An axis default option that allows this visualization without having to transform the columns will be very essential for new JMP users that are getting data from their manufacturing systems (e.g., Osisoft PI in JMP 17).
See how it is done in historians below (+video).

To be clear, this is already standard in JMP, but only if you put variables in one axis:

Again, the moment you add an X variable (DateTime), the plot squeezes variables using only one scale.
