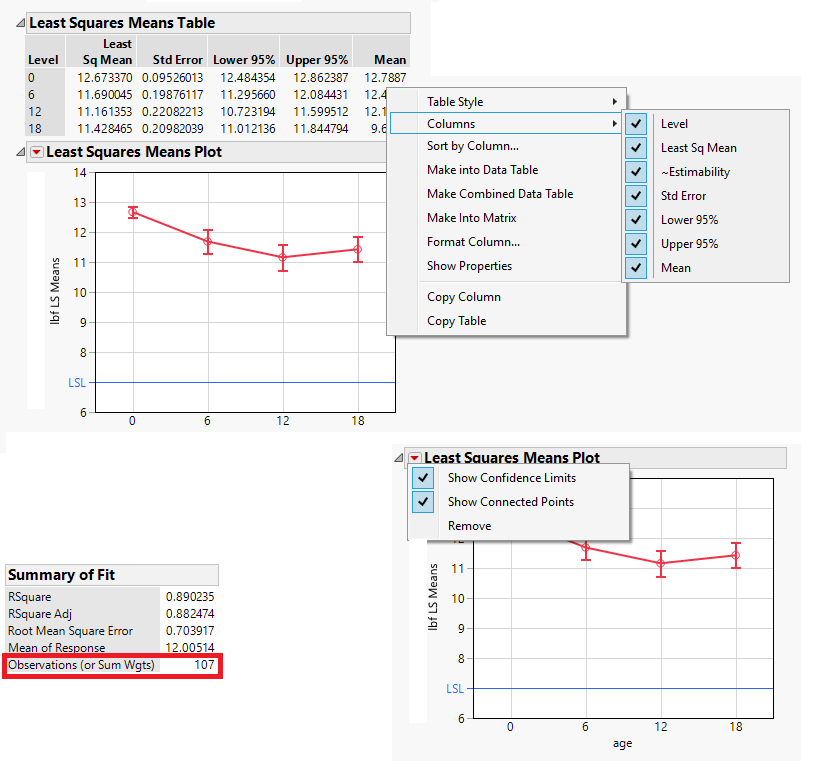
Hi, I think it would be a terrific idea to enable the option to turn on sample size (n) within Least Square Means Tables within the Fit Model Platform, particularly for cases of retrospective data analysis where sample sizes are often unbalanced across groups. The reason being is that the platform frustratingly shows you the total sample size for the model, but doesn't show you how many samples belong to each respective variable you are testing.
Also, while the LS Means Plots are an excellent visualization tool for comparing the LS means by group, they can be somewhat misleading to the statistically naive because they don't illustrate where the individual data values are located in relation to the mean location and LS mean error bars. For this I would recommend allowing the user to turn on the points as an overlay to the current Least Square Means Plot.