cancel
Showing results for 
Show  only  | Search instead for 
Did you mean: 
  • New to JMP? Join us Sept. 23-24 for the Early User Edition of Discovery Summit, tailor-made for new users. Register now for free!
  • Your voice matters! Tell us how you prefer to receive JMP updates, so we can tailor our communication to your needs. Take short survey.
  • See how to access JMP Marketplace - and - find, create & share add-ins to extend your JMP. Watch video.

JMP Wish List

We want to hear your ideas for improving JMP. Share them here.
Choose Language Hide Translation Bar

Individuals & Sample Size per Group in LS Means Plots (Fit Model Platform for multivariate analysis)

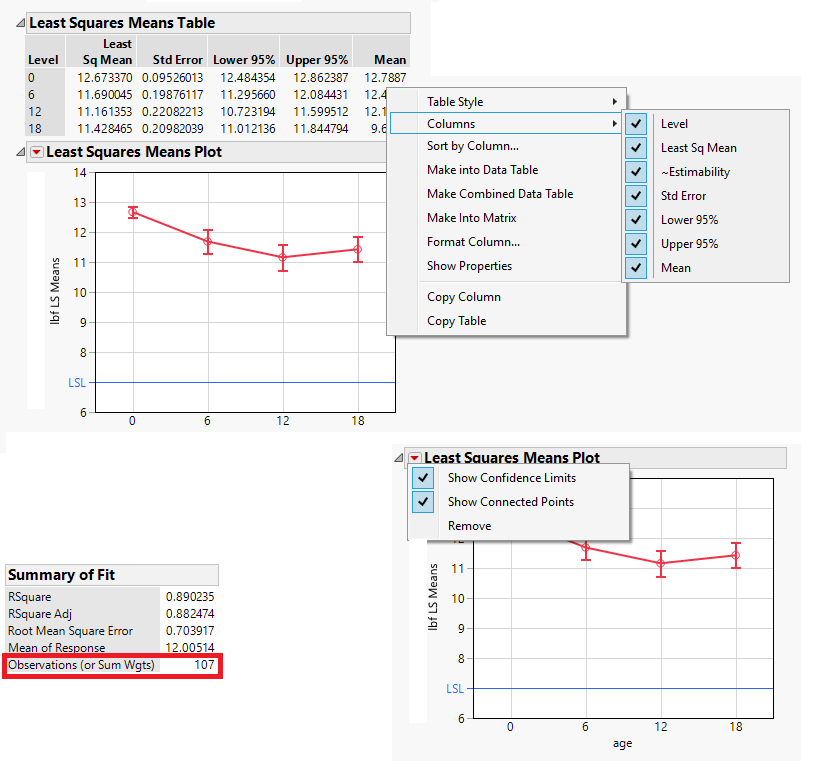
Hi, I think it would be a terrific idea to enable the option to turn on sample size (n) within Least Square Means Tables within the Fit Model Platform, particularly for cases of retrospective data analysis where sample sizes are often unbalanced across groups.  The reason being is that the platform frustratingly shows you the total sample size for the model, but doesn't show you how many samples belong to each respective variable you are testing.  


Also, while the LS Means Plots are an excellent visualization tool for comparing the LS means by group, they can be somewhat misleading to the statistically naive because they don't illustrate where the individual data values are located in relation to the mean location and LS mean error bars.  For this I would recommend allowing the user to turn on the points as an overlay to the current Least Square Means Plot.



1 Comment
Ryan_Gilmore
Community Manager
Status changed to: Archived
We are archiving this request. If this is still important please comment with additional details and we will reopen. Thank you!