cancel
Showing results for 
Show  only  | Search instead for 
Did you mean: 
Choose Language Hide Translation Bar
0 Kudos

Error bands on line chart in Graph builder

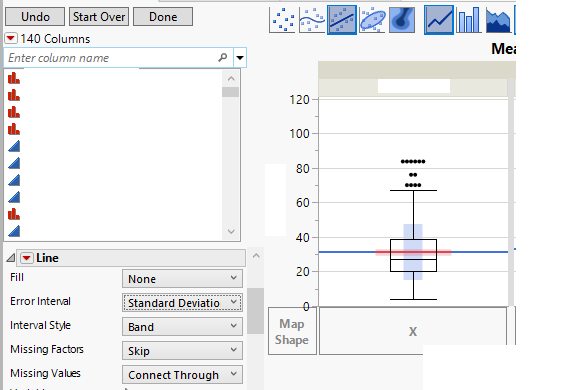
I'd like to see the change to the error band on graph builder to go over the entire line element vs just the center of the line.  See picture, in this example the error bar would go from one side of the graph panel to the other side of the panel, just just like the line is doing.  This would mimic the way the confidence intervals on the smoother works.


Thanks!


Steve

8 Comments
Status changed to: Acknowledged

@shampton82 - Thank you for your suggestion! We have captured your request and will take it under consideration.

Status changed to: Needs Info

@shampton82 Thank you for this suggestion! We would like to get some additional info on this request.  Why is this feature important to you and what problem would this solve? 

shampton82
Level VII

Morning Sarah,

The reasons for the ask is that it would make it easier to compare means of groups when using the Group X axis or overlay in graph builder.

For example, from big class data set:

shampton82_0-1664199932472.png


shampton82_2-1664200169961.png

so in these examples you can just follow the line to the edge of the panel to see if the error bands overlap, you have to extrapolate that in your head.


In this example, the error bands are harder to read being over the bar chart elements so having them run to the edge of the panel would make it easier to see what overlaps we have.

shampton82_3-1664200430075.png


Hope these help!  Let me know if I can clarify anything additionally.


Steve


Status changed to: Investigating

@shampton82 Thank you for the additional information! We are currently discussing this request with development to decide if it will be implemented in a future release.

shampton82
Level VII

Thanks for the update!

mia_stephens
Staff

Hi @shampton82 , when you use the Line element with no X variable the line spans the graph. It makes sense that the error interval should, too. However, this is not a very common use of the line element. As an alternative, the developer suggests using the Bar element with the Float style. When you do this, the interval and “bar” match widths.


I'll mark this as Not Planned for Now, but we can reopen if the suggestion does not satisfy your request.

mia_stephens
Staff
Status changed to: Not Planned For Now
 
shampton82
Level VII

Thanks for the update Mia!  I gave the float suggestion a try and that kinda works its just a bit picky as I have to go into customize and change the bar and error bar to "Width proportion" = 2x the number of categories (where 1 = the size of the bars) as well as can't use just overlay alone.  It looks like using the stacked option with the bands works pretty well though with the same need to have to hone in on a good "width proportion".


Side note, it does appear that the bands are slightly offset on the error bands when using the side by side option and default options:

shampton82_0-1669782962308.png


Some type of ANOVA/tukey analysis would be cool as well as thats really what I'm trying to do here (kidna like how we have some regression options currently available)