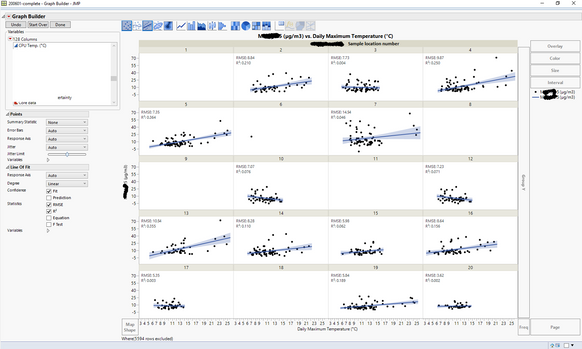
The idea is to add an option to allow users to display a multivariate correlation factor directly in Graph Builder, as can be done for RMSE or Rsquare with Line Of Fit for instance. This would help in instances where one wants to show that some linear correlation exist in some sampling locations while it is not the case in others. An anonymised example has been attached for more clarity. It is of course possible to make a dashboard with the multivariate results and Graph Builder but I don't find this ideal for Power Point presentations. I appreciate that the correlation factor can also be added manually on the Graph Builder but this can be time consuming when there are numerous plots.
