cancel
Showing results for 
Show  only  | Search instead for 
Did you mean: 
JMP Wish List

We want to hear your ideas for improving JMP software.

  1. Search: Please search for an existing idea first before submitting a new idea.
  2. Submit: Post your new idea using the Suggest an Idea button. Please submit one actionable idea per post rather than a single post with multiple ideas.
  3. Kudo & Comment Kudo ideas you like, and comment to add to an idea.
  4. Subscribe: Follow the status of ideas you like. Refer to status definitions to understand where an idea is in its lifecycle. (You are automatically subscribed to ideas you've submitted or commented on.)

We consider several factors when looking for what ideas to add to JMP. This includes what will have the greatest benefit to our customers based on scope, needs and current resources. Product ideas help us decide what features to work on next. Additionally, we often look to ideas for inspiration on how to add value to developments already in our pipeline or enhancements to new or existing features.

Choose Language Hide Translation Bar

Add superiority test to oneway analyses indicating the probability of being superior by different margins.

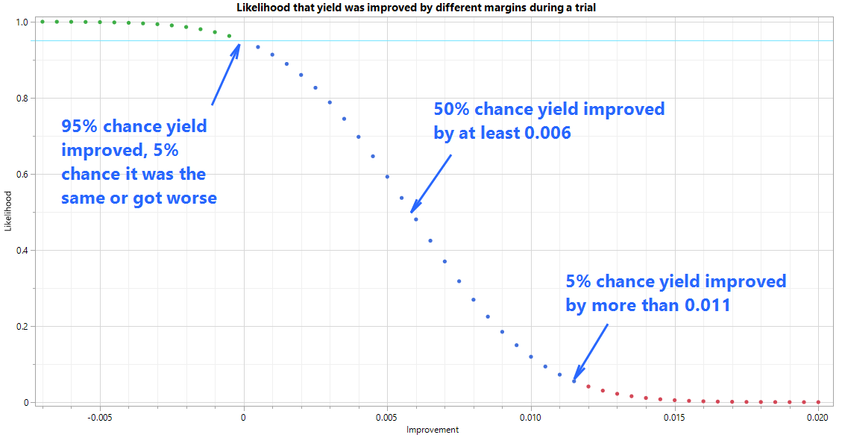
Add a test to produce p values of superiority tests at a range of distances and output those to a table or graph as shown below.
 

ih_1-1633695166276.png

Consider a trial where a process change is made.  Results are compared with current performance and a t test determines that the process was improved (the mean shifted) with a p-value of 0.05 and a superiority test in JMP 17 indicates that the mean shifted by at least 0.01 with a p value of 0.12, but neither tells a whole story.  To make an informed decision, we would want to know information like:

  • 5% chance the process stayed the same or got worse
  • 90% chance the process improved by at least 0.01
  • 50% chance the process improved by at least 0.006
  • 5% change the process improved by at least 0.011

Here is a post with two potential methods of calculating these values:

Compare means test: graph probability by difference in means