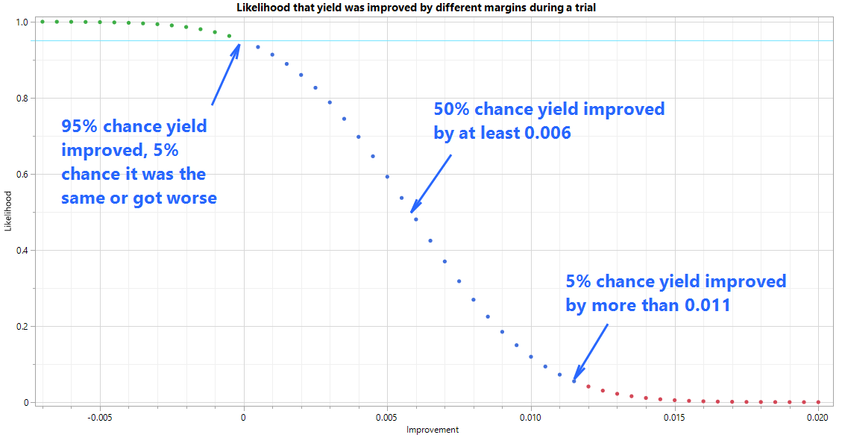
Add a test to produce p values of superiority tests at a range of distances and output those to a table or graph as shown below.

Consider a trial where a process change is made. Results are compared with current performance and a t test determines that the process was improved (the mean shifted) with a p-value of 0.05 and a superiority test in JMP 17 indicates that the mean shifted by at least 0.01 with a p value of 0.12, but neither tells a whole story. To make an informed decision, we would want to know information like:
- 5% chance the process stayed the same or got worse
- 90% chance the process improved by at least 0.01
- 50% chance the process improved by at least 0.006
- 5% change the process improved by at least 0.011
Here is a post with two potential methods of calculating these values:
Compare means test: graph probability by difference in means