This guide provides instructions for creating I & MR (Individuals and Moving Range) control charts using the Control Chart Builder and the Control Chart platform. I/MR control charts are used to monitor a continuous variable where the data is sampled without subgroups.
I/MR Charts – Control Chart Builder
- From an open JMP® data table, select Analyze > Quality and Process > Control Chart Builder.
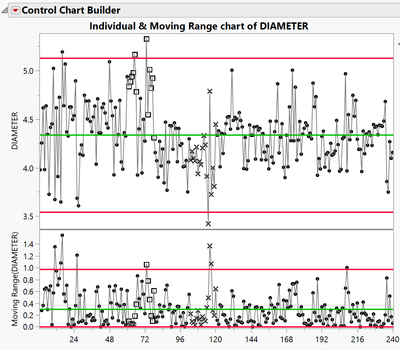
- Drag a continuous variable from Select Columns (continuous variables have blue triangles), and drop it in the Y zone. By default, JMP produces a control limit summaries table and two charts: Individuals (Individual Measurements) and Moving Range (the moving range between each pair of consecutive points). Right-click on the graph and select Limits > Sigma to change the method for estimating the standard deviation.
- If available, drag and drop a variable in the Phase zone (top), and click the Done button when finished.
I/MR Charts – Control Chart Platform
- From an open JMP data table, select Analyze > Quality and Process > Control Chart > IMR Control Chart.
- Select one or more continuous variables from Select Columns, and click Process. Add a variable defining phases into the Phase role if desired. Click OK.
Notes:Additional options, such as tests for special causes, are available from the Red Triangles in the Control Chart platform (or Right-click on the graph in the Control Chart Builder).
 Diameter.jmp (Help > Sample Data Folder > Quality Control)
Visit Quality and Process Methods > Control Chart Builder and Legacy Control Charts in JMP Help to learn more.