XR Charts
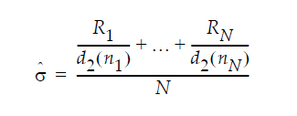
In an XBar chart that uses the R option, the value for sigma is computed as:

where:
Ri = range of ith subgroup
ni = sample size of the ith subgroup
d2(ni) = expected value of the range of ni independent normally distributed variables with unit standard deviation
N = number of subgroups for which ni ≥ 2
XS Charts
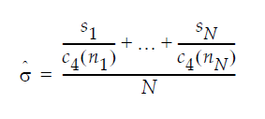
In an XBar chart that uses the S option, the value for sigma is computed as:

where:
ni = sample size of ith subgroup
c4(ni) = expected value of the standard deviation of ni independent normally distributed variables with unit standard deviation
N = number of subgroups for which ni ≥ 2
si = sample standard deviation the of ith subgroup
IR Charts
In an IR chart that uses the Moving Range (Average) option, the value for sigma is computed as:

where:
R-bar is the average of the moving ranges
d2(n) (unbiasing factor) is the expected value of the range of n independent normally distributed variables with unit standard deviation, where n is the value of the Range Span option
In an IR chart that uses the Median Moving Range option, the value for sigma is computed as:

where:
MMR is the median of the non-missing moving ranges
d4(n) (unbiasing factor) is the median of the range of n independent normally distributed variables with unit standard deviation, where n is the value of the Range Span option
[Previously JMP Note 36576]