cancel
Showing results for 
Show  only  | Search instead for 
Did you mean: 
  • New to JMP? Join us Sept. 23-24 for the Early User Edition of Discovery Summit, tailor-made for new users. Register now for free!
  • Use World Cup data to build models, explore spatial relationships, and create informative visualizations in JMP. Register. July 17, 2 pm US Eastern Time.
  • Your voice matters! Tell us how you prefer to receive JMP updates, so we can tailor our communication to your needs. Take short survey.

JMP Knowledge Base

Choose Language Hide Translation Bar
移動平均管理図で用いられるシグマ(標準偏差)はどのように計算されているのですか?

EWMA and UWMA 管理図

σの推定値

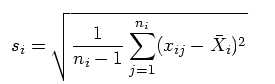
1.png

N n i ≥2 となるサブグループの数、 s i i 番目のサブグループのサンプル標準偏差です。

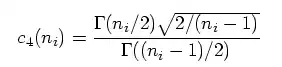
2.png

3.png

ここで 4.pngはガンマ関数を表し 5.png i 番目のサブグループ平均を示します。

サブグループの標準偏差 s i は、 n i ≥ 2.のときに限り計算に含めることができます。
オブザベーションが正規分布に従うとき、 s i の期待値は c 4 (n i になります。
したがって、6.png N 個の σの不偏推定値の単純平均です。

各々のサブグループのサンプル数が1 ( n i =1) のとき、σのプロセス標準偏差は、以下の式で推定されます。
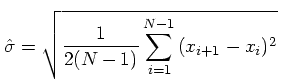
7.png

ここで N はオブザベーション数を示し、 x i ,x 2 ,...,x n は個々の測定値を示します。

Details

Recommended Articles