JMP Challenge
Challenges that focus on the JMP Scripting Language and occasionally, some that can be done without scripting.- JMP User Community
- :
- Blogs
- :
- JMP Challenge
- :
- Challenge 9 results
- Subscribe to RSS Feed
- Mark as New
- Mark as Read
- Bookmark
- Subscribe
- Printer Friendly Page
- Report Inappropriate Content
Let’s start with an interactive solution. The table operations Summary and Join can be used to determine unions, intersections and differences. Unions are the simplest, just put everything in one column and Group by that column. The union, with duplicates removed, appears as the first column in the resultant table. To find an intersection, start by creating a one column table for each input set, and then join the tables together two at a time making sure to Include non-matches and Drop multiples for both sets. You need to retain only one of the resulting columns since they are identical. The intersection will be those rows remaining after all tables have been joined. To determine differences, start by creating the union of all the sets. This will serve as a master column. Then, join each set back to the master column making sure to include non-matches (but still dropping multiples). Missing Data Pattern can be used to identify the values unique to each set. It will be those rows in the Missing Data Pattern table that have only one 0.
Scripting this solution allows for a few options. A simple and fast way to get the union is to load all the values into a list, and then use Summary to find the unique values. Previously, we have seen that concatenating vectors can be slow, so using this for both numbers and characters is best.
Surprisingly, there’s a faster way to get numeric values into a table by skipping the list and loading them directly into a table. I was made aware of this by @brady_brady during our discussion of this problem. Start by counting the number of items, add that many rows to the table, and-then loop over the input one more time to add the values to the table. A quick check of the two data-loading methods shows the latter can be 2-3X faster. An example of both methods applied to the union of two or more sets is given in Union using table operations.JSL. It offers only a slight improvement when working with character data.
Once the data is loaded into a table and summarized, the intersection and difference operations are derived from joining each set back to the summary data. As mentioned above, for intersections, if we Join, dropping multiples and only retaining matches, the last table joined will contain the intersection. The joining process is stopped early if at any time it produces a table with no rows, indicating the intersection is empty. For the difference, non-matches are kept (but multiples dropped). The differences are found using Missing Data Pattern. Examples of how these operations can be coded is found in Set Functions using Table Operations.JSL
How does this compare to a purely scripted solution? A fast and tidy way to script unions, intersections and differences is to use Associative Arrays and their concomitant set operational messages (e.g., Intersect and Get Keys). An example of this was given by @jthi in the previous post. I’ve provided another set of examples in Set Operations using Associative Arrays.JSL. The two sets of functions look very similar, the main difference is that I have avoided Recurse. As much as I love recursion, I worry (rightly or wrongly) that it will slow if it gets too deep.
I ran a number of simulations varying conditions as shown in the table below to compare the speeds of Associate Arrays vs. table operations. Each simulation was run 10 times with a new set of randomly generated values. Each set was the same size and consisted of either random integers or character strings. For character data, Set Density corresponds to the string length, whereas for numeric data, the range of random integers was set to 10^Set Density.
|
Data Type: |
Numeric or Character |
|
Number of Set Elements: |
25, 100, 1000, 1e4, 1e5 |
|
Number of Sets: |
2, 3, 5, 10, 25 (only 2 used for Difference) |
|
Set Density: |
2, 3, 4, 5, 6 Indicates string length or 10x integers |
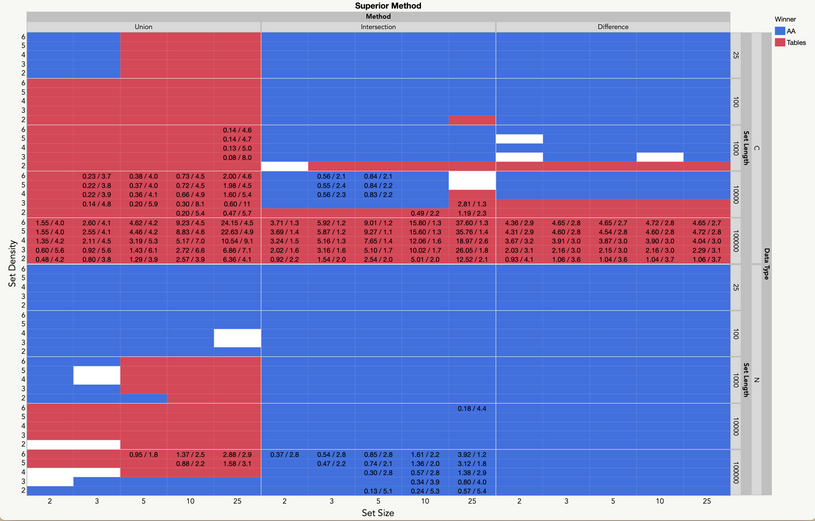
The graph below summarizes the results. The colored squares correspond to cases where an approach showed a superior time in at least 9 of the 10 replications. Anything less was considered a draw. All but 15 of the 750 cases had a clear outcome with Associative Arrays coming out on top about twice as often. Also displayed are the median times for the faster method along with the processing time improvement (slower time/faster time). These values are only shown where the median absolute difference (the median difference among the 10 runs within a set of conditions) was 0.5 seconds or more. So, while the Associate Array approach won more often, many of the time differences were a half second or less. The noticeable exception is for Intersection with integer data: The difference appears to increase as the data sets get bigger and the number of sets increases. The opposite is true for character data, however, where data table operations are considerably faster. From the results, we can see that table operations are the way to go for Union for nearly all character data type and numeric data with sets of more than 100 members. Complete results can be found in Challenge 9 results 1.JMP and are summarized in Winners 1.JMP.
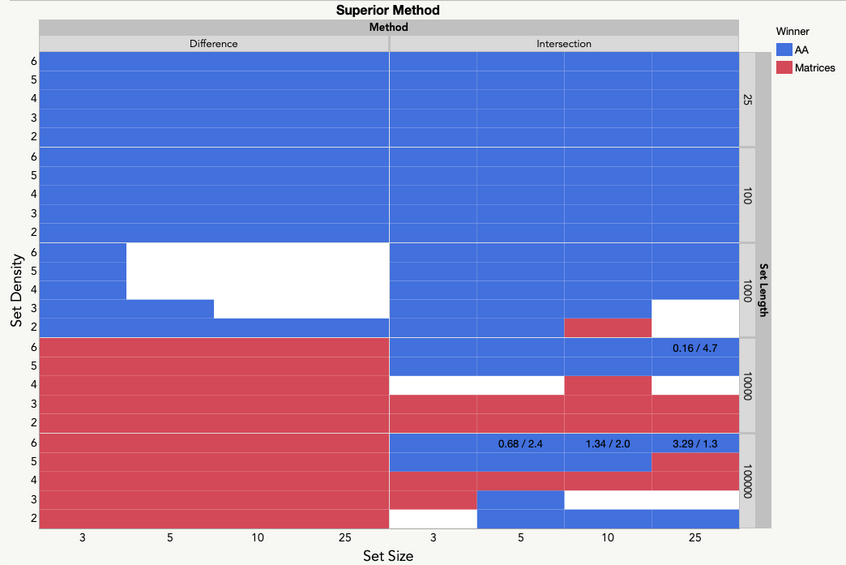
And we might be able to go faster (for integer data, at least). In the previous simulation, the Associative Array approach was superior to table operations under all conditions involving Intersection and Difference for numeric data. If we employ a look-up matrix approach, however, this advantage diminishes. An example of this approach is found in Set operations using matrices.JSL and is thanks to @brady_brady. The graph below shows that, for sets of 10,000 or larger, the matrix approach shows a small (<0.5 second) advantage under all conditions for Difference and an advantage for about half the cases for Intersection. That said, the simplicity of the Associative Array approach would have me favoring it over either of the other approaches. Full results of the simulation can be found in Challenge 9 results 2.JMP and are summarized in Winners 2.JMP. The difference routines for table operations and matrices are easily extended to more than two sets of data.
- © 2026 JMP Statistical Discovery LLC. All Rights Reserved.
- Terms of Use
- Privacy Statement
- Contact Us


You must be a registered user to add a comment. If you've already registered, sign in. Otherwise, register and sign in.