- Don’t miss your chance to experience Discovery Summit Europe at our best available rate! Early bird registration through 31 Oct.
- Graph Builder Toolbar streamlines interactive graphing. Creates shortcuts on Report and GraphBuilder Helpers toolbars. Download and install the extension.
JMPer Cable Blog
A technical blog for JMP users of all levels, full of how-to's, tips and tricks, and detailed information on JMP features- User Community
- :
- JMPer Cable Blog
- :
- Teaching with JMP Student Edition: JMP Assistant in practice - what it can do fo...
- Subscribe to RSS Feed
- Mark as New
- Mark as Read
- Bookmark
- Subscribe
- Printer Friendly Page
- Report Inappropriate Content


Every data analysis journey has that awkward moment. You’ve got your data set open. You kind of understand the question. And then – nothing happens. Not because the statistics are too hard, but because the steps between “I have data” and “I’m doing analysis” feel unnecessarily complicated. Which menu? Which variables go where? What is this analysis even called?
JMP Assistant does not solve that dilemma by thinking for the student. It solves it by making the doing fast enough that we can spend class time on what actually matters: discerning what the result means, whether it answers the right question, and what to do next.
Two tools, one clear distinction
Before going further, it is worth being precise about how Assistant differs from LearnBot, which we introduced in Episode 2. The distinction is simple and important:
- LearnBot [4] is a tutor for both JMP and statistics at large. It answers general questions (“What does VIF mean?”, “Which analysis should I use?”) in plain language. It is text-only and lives in the Help menu. It does not interact with your data and does not execute anything in JMP.
- Assistant [3] is different in a fundamental way: it acts. It is aware of your open data sets and open analyses, understands your question in context, generates JMP Scripting Language (JSL) code behind the scenes, and runs the analysis directly in JMP – producing real output you can inspect, modify, and build on. LearnBot talks you through it. Assistant does it with you.
What Assistant does: no mystery
Assistant [3] is available for free from the JMP Marketplace. Once installed, it appears under Add-Ins in JMP’s menu. The basic workflow in Run mode, which is the default, is straightforward:
- Open your data table in JMP Student Edition and launch Assistant.
- In the Window Context panel, select the data set and any open analyses that you want to work with.
- Type your analytical question in plain language, or choose from suggested starting points.
- Click Send. Assistant generates JSL code, executes it immediately, and returns results with an explanation of what was done, what to look for in the output, and suggested next steps.
Assistant keeps a chat history of your analytical conversation. Previous chats are accessible from the left panel, though reopening an old chat may require the relevant JMP windows to be open to restore its full context.
For interpretation questions about output you’ve already generated, switch to Ask mode. Ask does not run new code; it responds to what you describe, with the advantage of knowing your current analysis context. Both modes are available from the same window, selected before clicking Send.
Personalizing the experience
Assistant’s settings allow users to configure their Role (engineer or scientist), Branch (from a long list covering aerospace, biomedical, chemical, environmental, and many more), and JMP Experience Level (1 to 5). These settings shape how Assistant frames its responses: the language, the examples, the level of detail.
For teaching, these options matter. An instructor can ask students to set their branch to match the course context and their experience level honestly. A Level 1 student and a Level 5 researcher will get appropriately different responses to the same prompt. That difference is itself worth a classroom discussion.
What it looks like in practice
The following example uses the Palmer Penguins data set, a well-known teaching resource available through JMP, to show what a real Assistant workflow looks like from question to insight.
A student wants to explore the relationship between bill dimensions across penguin species, so she types in: “Is there a relationship between Culmen Length and Culmen Depth per penguin species? I would prefer a single graph showing all species together.”
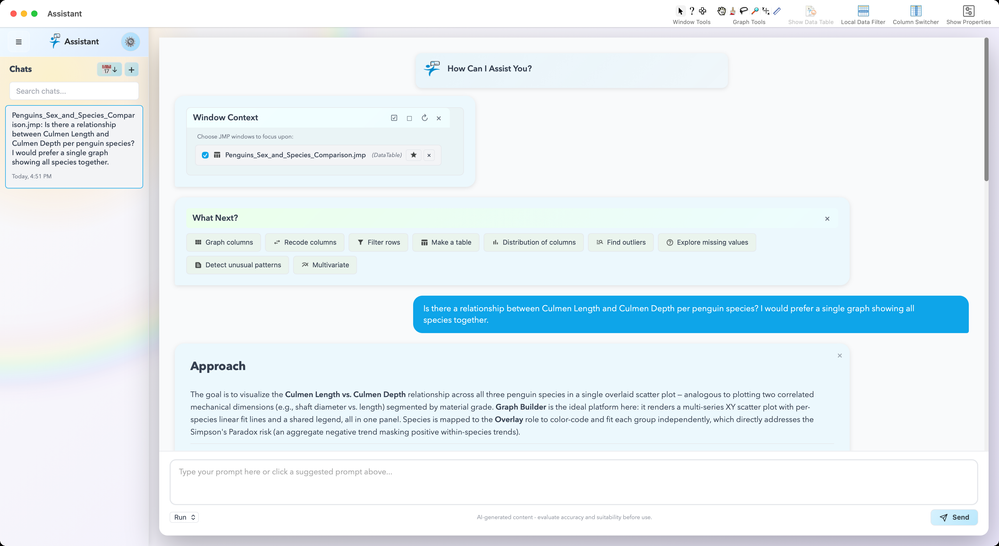
Assistant responds first with an Approach, explaining that Graph Builder is the right platform for a multispecies overlaid scatter plot. It also flags the Simpson’s Paradox risk: an aggregate negative trend can mask positive within-species trends. The student sees the reasoning before the result.
Then it runs. The scatter plot appears in JMP Student Edition with per-species regression lines and confidence bands.

The JSL code that produced the graph is visible and inspectable, which may be a sidenote for most introductory students but a genuine learning resource for more advanced courses.
In every Run mode response, Assistant always produces two structured follow-up sections: What to look for in the JMP results? and What analyses should be run next? Each one is concrete, numbered, phrased as possible next prompts.

No hunting through menus. No switching tabs. Just a question, an analysis, and a clear path forward.
The question is the skill
Here is what becomes visible very quickly when students use Assistant: the quality of the output depends entirely on the quality of the input. Formulating a precise, meaningful analytical question is no longer a preliminary step; it is the central skill.
Compare these two prompts:
- ✘ “Analyze my penguin data” produces vague results and limited insight.
- ✔ “Is there a relationship between Culmen Length and Culmen Depth per penguin species, shown in a single graph?” produces exactly the analysis shown in the screenshot above.
The second prompt is the one the student typed in Step 1. A student who cannot formulate it has not yet understood the problem, and no AI tool will formulate it for them.
|
"Good analysis starts with a good question. No AI tool will ask it for you." |
One important reality check
JMP Assistant is not a data scientist. It does not understand your research context. It translates your question into an analysis – nothing more. If your question is off, the answer will also be off. Treat it as a starting point, not a verdict. The AI-generated content disclaimer visible in every Assistant session is a reminder that the student’s judgment remains the final step in every analytical workflow.
What this means for instructors
The most immediate benefit is time. Students no longer spend 20 minutes finding the right menu. Since they can start analyzing in seconds, time is freed up to focus on what really matters: understanding results.
When students arrive at class with analyses already run, the discussion shifts from “How do I do it?” to “Did we ask the right question?” What do these results actually mean? Would a different approach change the conclusion?
Episode 4 addresses the other side of this picture: where AI in the classroom creates real risks, and what instructors can do to build guardrails that keep the reasoning intact.
Try this
Install JMP Assistant [3] for free from the JMP Marketplace. Open a data set you already use in your course. Ask Assistant the question your students most often get stuck on. Then, instead of focusing on the answer, ask yourself: How would I turn this output into a discussion? That shift in perspective is where the pedagogical value of the tool becomes clear.
References
[1] JMP Academic Program, jmp.com/academic
[2] JMP Student Edition, jmp.com/student
[3] JMP Assistant (JMP Marketplace), marketplace.jmp.com
[4] LearnBot (JMP Marketplace), marketplace.jmp.com
[5] How JMP’s visual interface is bolstered by natural language-empowered analytic workflows, D. Valente, JMP Community Blog
[6] GAISE College Report revision (in progress, 2025)
About the Author
Volker Kraft is Principal Academic Ambassador (EMEA) at JMP Statistical Discovery (a SAS company), part of the JMP Global Academic Team. Since 2011, he has supported universities across Europe in integrating JMP into teaching and research. His background is in speech technology research, a field where statistical rigor and engineering pragmatism had to coexist long before AI became a household word. He can be reached via the JMP Community or on LinkedIn.
Episode 3 of 5 • Next: Teaching responsibly with AI: risks, guardrails, and what I’ve learned the hard way
You must be a registered user to add a comment. If you've already registered, sign in. Otherwise, register and sign in.
- © 2026 JMP Statistical Discovery LLC. All Rights Reserved.
- Terms of Use
- Privacy Statement
- Contact Us