As time goes by, retirement age creeps up on us and the age-old question comes up again and again. "When should I start taking my Social Security benefits?” My colleague Scott Wise and I realize this is a question most directly related to the United States, but other countries also have social pension systems and are faced with similar questions.
First and foremost, our JMP colleague @Peter_Hersh wrote an article on the same topic in 2015. We would recommend reading both this and Peter’s blog posts to help you make a better-informed decision with the information provided. As Pete also said, none of us are Certified Financial Planners. We examined these numbers out of purely personal interest to see if the conventional wisdom of delaying collecting our Social Security benefits as long as possible was correct.
We agree with delaying collecting benefits if you plan to keep working well into your 60s and early 70s because your Social Security benefits are taxed heavily for any earnings beyond $18,240. We will use the value for 2020 (but remember, it does go up every year). To give you some idea of the penalty, for every $2 you earn over $18,240, your Social Security benefit is reduced by $1. (If you are interested in what these penalties are, which are much more complex than what we are describing here, you can find a lot more information online.) We are mainly interested in the accumulated values to see if the government was trying to pull a fast one. In reality, they aren't, but there is some food for thought on retiring before your full retirement age!
A couple of things to consider first: According to the latest published (2017) Social Security actuarial tables, the average life expectancy for a 62-year-old male is 20.08 additional years and 22.90 additional years for a 62-year-old female. At age 67, those numbers are 16.47 years for males and 18.86 years for females. Eighty-year-olds should expect to live another 8.28 and 9.68 years, respectively. Keep these numbers in mind when making your own decisions. You don't want to outlive your money if at all possible!
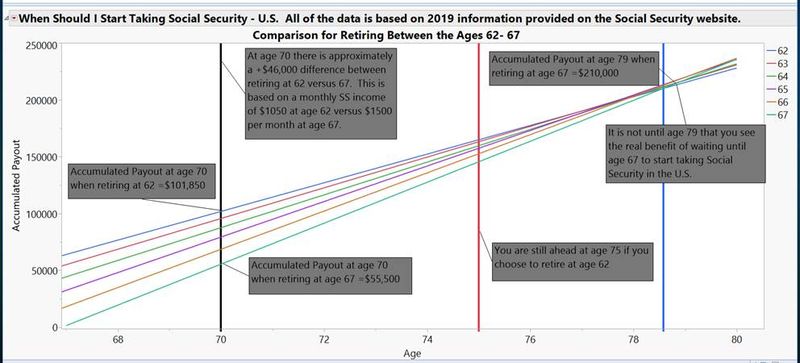
More background: In 2020, the average Social Security benefit for all "retired workers" is $1,503. So, we will assume $1,500 for full retirement benefits at age 67. Please keep in mind the numbers that we provide below are based solely on percentages provided by the US government on the Social Security website. You can clearly benefit from saving part of your benefit if you start collecting early, and there is a significant windfall to you personally if you start collecting benefits at 62. For comparison, see the graph that I created below and focus on the two points that are tagged at age 70.

Accumulated payout for Social Security ages 62 - 67
These values are again based on $1,500 full benefit at 67. If you started collecting benefits at 62, by the time you were 70, you would have accumulated $101,850 in benefits. If you started at 67, you would have accumulated $55,500. That’s $46,350 more. That's significant, and if you are able to invest some of that money, you'll be even further ahead. Another point on the graph is around the age of 78.5 years, the spot where the amount accumulated from 62 and the amount accumulated from 67 cross over. Comparatively, at 80, that difference is less than $10,000. One other thing to take a look at is age 66 vs. 67. You may not think one year is a big deal, but you will be more than 80 years old before the intersection point occurs where you will have accumulated more money. You can interact with this graph and access the data on JMP Public.
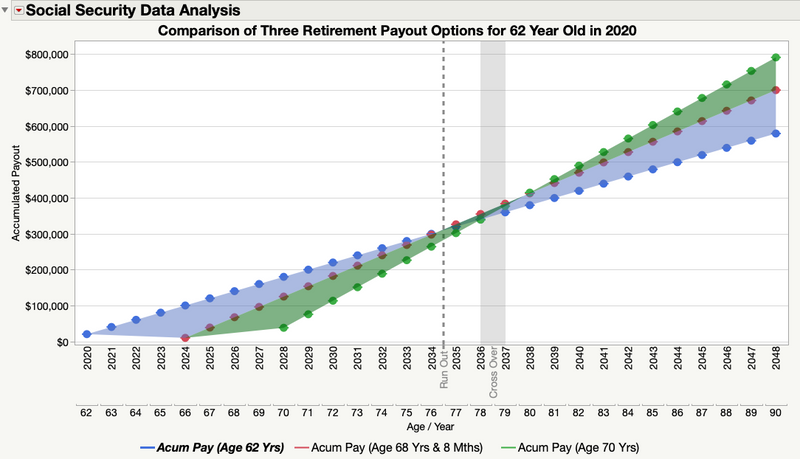
What if we needed to make that decision on when to take Social Security right now in 2020? Scott tackled this question by making a few additional assumptions and creating an additional graph. First, we took a typical 62-year-old in 2020 (so born on 01/01/58) with a highest last yearly income mark of $100,000. If they had no disruption in their Social Security participation throughout their work career, they would expect a monthly payment of $1,663 if they begin taking payments in 2020 at age 62. In 2026 (at age 68 years, 8 months), the last payment goes to $2,396 per month. Lastly, the monthly payment would go up to $3,138 if they wait until age 70 in 2028.
Scott’s accountant likes to say all things being equal (cost of living and medical expenses will increase no matter your retirement choices, etc.), there are only three questions to ask:
- How long are you going to work?
- How long are you going to live?
- When do you fear the Social Security system may run out of money!?
I have addressed the first two questions, but the last one is quite sticky! It is a fact that at some point in the future, the amount of outgoing total payments to retirees will outpace the level of total incoming money from younger workers, eventually draining the reserves of the Social Security System and “bankrupting” it. Some feel the government would surely intervene and save Social Security well before the system can no longer make payments. However, it may be that when that happens, the program will be changed significantly, and payment levels will be lowered. Therefore, if you are more as pessimistic as my accountant is, you may believe the current calculations that predict the money will run out sometime after 2034.

Accumulated payout associated with year (starting at 2020) and potential SS funds running out.
For another way to determine when we should take our payments, we built this graph to look at the differences in ranges between the Accumulated Payment Option lines by Year. We also added a second Age label under the Year Label and colored in the ranges in between the Accumulated Payment Option Lines. We put in Axis Reference Lines and Ranges to show both the point at which the program may run out of money as well as the zone of crossover at about age 78. Again, we would agree with my graph that unless you want to continue to work deep into your retirement age, it would seem to make sense to take your payments earlier to not only gather and invest the money now but to beat the unpredictable effect of possible planned changes to the program around 2034. You can interact with this graph also and access the data on JMP Public.
Long story short: You should use this blog post only as a guide. Use the links above and put in your own values and age to see where you fall in the graphs. It's not only fun to play with, but it's also eye-opening to see just how fast the dollar value accumulates over time. If you have good genes and think you will live well past 80, then we would say go ahead and extend the tables a few years to see the difference. It may change your mind!