You may have heard about the replication crisis in research — particularly in the field of psychology. One of the litmus tests for research is that results should be replicable, i.e., another researcher working under the same conditions and using the same methods should be able to produce similar results. More and more, scientists are becoming concerned that a lot of published research isn’t replicable, either because the data is unavailable or because the findings are based on small samples that don’t generalize to the larger population. The complicated nature of some research means that coding errors in the data analysis can cause misleading results, and those problems may be nearly impossible to find. There’s also much concern about p-hacking — where researchers test dozens of hypotheses and only report the ones that are significant.
This should give those of us in marketing science and market research pause. Many of the criticisms above apply to our routine methods. We often comb through customer surveys looking for patterns, ignoring the ones that don’t seem to fit. Our reports to management highlight significant findings and leave out the details of how we got there, including data transformations, excluded subjects, and research methodology. The short timelines for most market research projects mean that results need to be turned around fast, and working quickly makes it easier to make mistakes.
Never mind that the things we most want to measure are concepts. Customer happiness, likeliness to recommend, product appeal — these are all ideas that are valuable to our business. They’re also inherently noisy and famously misleading. A potential customer might like the look of a new car, but that doesn’t meant he or she will buy it. A customer who’s happy with a product offering today might be furious when a competitor offers a similar product at a lower price tomorrow. Likeliness to recommend might make sense for professional services like lawyers and plumbers, but does it mean anything to a local coffee shop?
None of this excuses us from doing our jobs carefully. In fact, it’s my opinion that the particular issues of market research make it all the more important that we follow the rules of good science, some of which I mentioned in an earlier post.
The Fault in Our (Analytical) Tools
Traditionally, statistical analysis tools are based on a scripting language of some kind (R, SAS, SPSS), or on point-and-click actions from the user (JMP, Excel). In order to reproduce the steps for an analysis, you have to depend on the researcher to document and collate the code (no easy task), or you have to somehow document the mouse clicks. In both cases, it’s up to the researcher to write everything down, which is time-consuming and error-prone. The need for better documentation of the research process has inspired scientists to build tools that help combine data, code, and documentation so other scientists can reproduce their findings.
JMP Scripting Language As Documentation for Analyses

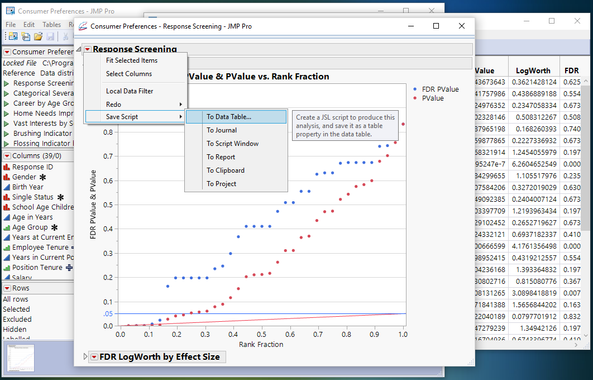
One of my favorite JMP features is the “Save Script to Data Table” option that’s under the red triangle menu of any platform. JMP was originally developed for scientists and engineers. Early on, it became obvious that even though the product was meant to be point-and-click, our intended users needed to re-create those mouse clicks with the push of a button, and so the JMP Scripting Language was born.
Saving the script to the data table means that anyone who has the data can re-create the analysis. They can also explore further, changing settings, excluding or un-excluding rows, or trying different transformations. Their work can then be saved to the data table as well, and re-shared with other colleagues. Yes, you can do this with other software platforms, but JMP’s tools are some of the easiest and most intuitive I’ve seen.
Row Hide and Exclude, Formula Columns: Self-Documenting Data Changes
Not everyone answers your questions carefully, even machine measurements are sometimes inaccurate or misleading. There are valid reasons for excluding rows from analysis, but there are also lots of reasons to make sure that all of those excluded rows are documented and readily available when you want to re-check your work.
In JMP, you can Exclude a rows from your analysis so they don’t affect the statistics calculated but still appear in graphs. You can Hide and Exclude if you don’t want to see them at all. The data table shows how many rows are hidden and excluded, so you can always be aware that you’re not using all of the data. There’s also the Data Filter, which lets you look at subgroups interactively.
Transforming data is common method for regression analysis. Using the JMP Data Table's Formula Editor, you can create new transformed columns and always have a record of exactly how you did it.
Response Screening: Check for Relationships Without Accidental p-Hacking
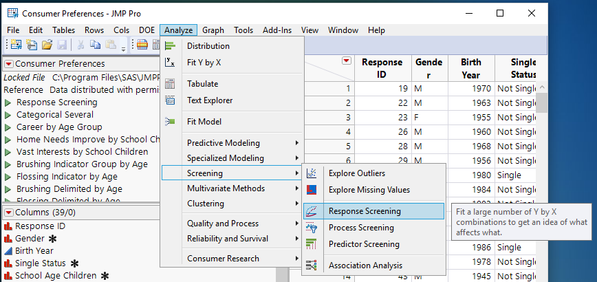
It’s very easy to test hypotheses one at a time without realizing how many you’re testing or keeping track of your “true” error. It’s also time-consuming. Wouldn’t it be great to test all the relationships in your data without having to do individual analyses and be sure that you’re not just seeing noise in the data? You can — with the Response Screening Platform.
The Response Screening platform lets you specify all the pairwise relationships you want to test. For each pair, it detects the kind of data you have (Norminal, Ordinal, and Continuous) and performs the right type of test for that pair. The resulting report takes into account how many tests you requested and gives you a realistic view of which relationships are statistically significant.

This isn’t a perfect technique because it only tests pairwise relationships. Each point on the report represents a test that’s done without considering the relationships with the other columns. It is, however, fast and easy to use, and it’s a lot better than just hacking your way through all the possible comparisons and trying to keep track of how many you’ve checked.
Sometimes the Answer Is Uncertain, and You Need to Try Again
One of my favorite stories about market research is an example I’ll be showing at our JMP Explorer’s event in London two weeks from now. It’s a MaxDiff experiment I designed to see which events for a local data science group were the most popular. The results were — unremarkable. That one uninteresting result, however, led me and my team to think differently about how we were planning events and reaching out to our customers.
If your market research team feels pressured to show results from every analysis, they’ll find results to show. That’s another aspect of the reproducibility crisis that we don’t talk about very much. Negative results can offer as much insight as positive results if we give our research teams permission to report them, but if they feel pressured to report something new from every project they run, you'll never find those hidden gems of information.
The Report Isn’t the End Product
As I said in an earlier blog post, static reports with no data and without the steps to reproduce the analysis are a missed opportunity. Past analyses can be a treasure trove for your market research team — if you provide an infrastructure that makes reproducing those results easy and intuitive. JMP is one software system that has built-in support for keeping your reports, code, and data all in one place. Try it for free!