A great use for JMP Live is the automatic publishing of a daily report. These reports can come in many forms across lots of industries – daily yield reports, overnight production summaries, campaign registrations, just to name a few. And in many of these daily "x" reports, there is the desire to automatically separate the vital few parameters or measurements from the trivial many.
In some industries, like the semiconductor industry, there may be hundreds or thousands of potential measurements; going through them one at a time is not the most efficient way to analyze the data, especially if it needs to be done every day.
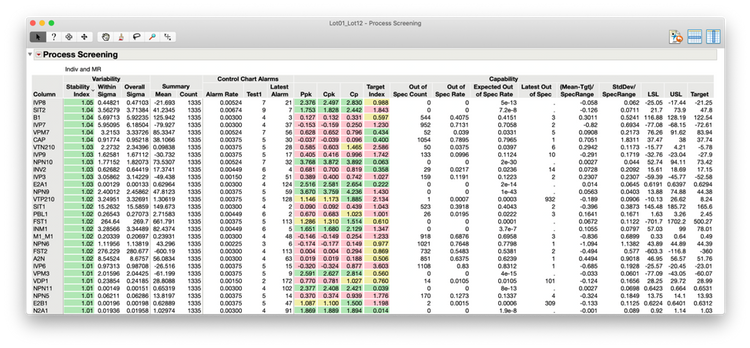
The Process Screening platform in JMP provides an automated way to look through many parameters or measurements, offering measures of variability, control chart alarms and capability measurements. It then lets the user sort the measure(s) of interest.
When used as the center of a JMP Live publish workflow, the Process Screening platform allows report consumers to focus solely on the parameters that need to be triaged and managed.
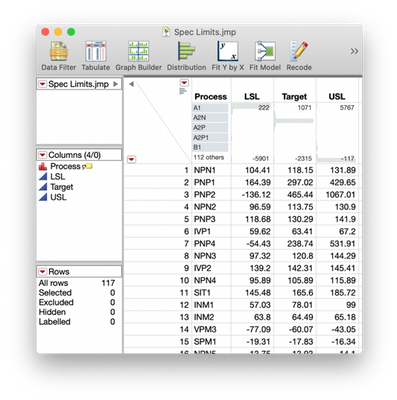
This example uses one of the sample data files included with JMP (semiconductor capability.jmp). I also have a table of Spec limits, stored in a JMP data table, that can be read in. 
First, we run the Process Screening platform in a script to make sure it is addressable later in the script. Using this set of selections, we then generate individual Control Charts if one of many measures misbehaves.
obj = dt << Process Screening(
	Y(
		:measure1
		…
		:measureN
);
Here is the JSL for making those selections:
// Specify conditional thresholds for control charts
obj << select where (:Cpk < 0.2);
obj << control charts for selected items;
obj << select where (:Stability Index > 1.03);
obj << control charts for selected items;
obj << select where (:Out of Spec Rate > 0.3);
obj << control charts for selected items;
obj << select where (:Alarm Rate > 0.005);
obj << control charts for selected items;
While this selection is based on CPK, Stability Index, Out of Spec Rate and Alarm Rate excursions, your selection of interest may be different for your particular use.
The resulting template generates an overview of the process with the Process Screening platform. There is also the Process Capability platform for context and individual control charts to focus on specific conditions.
To publish to JMP Live, we us the standard publishing syntax as shown below. First, find all the open reports and give them titles based on what they are displaying:
windows = Find All( Reports );
windows[1] << Set Report Title("Process Capability Report");
windows[2] << Set Report Title("Process Screening Report");
windows[3] << Set Report Title("Control Charts: Low Cpk");
windows[4] << Set Report Title("Control Charts: High Stability Ratio");
windows[5] << Set Report Title("Control Charts: High Out of Spec Rate");
windows[6] << Set Report Title("Control Charts: High Alarm Rate");
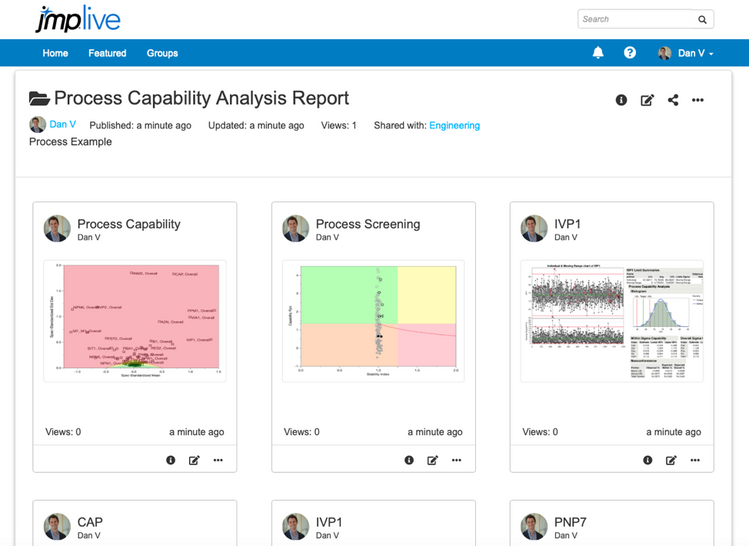
Next, organize them into a collection of reports in preparation for publishing to JMP Live; give the report a title and description of the process.
If( N Items( windows ) > 0,
		webreport = New Web Report();
		webreport << Add Reports( windows);
		webreport << Index(
			Title( "Process Capability Analysis Report" ),
			Description( "Process Example" ),
		);
);
Publish to JMP Live (with option replace and group options):
// External JMP Live Server
url = webreport << Publish(
	URL("JMP Live URL"),
	Username("JMP Live Username"),
        Replace("Package ID"),
	Groups("Group"),
	Prompt(IfNeeded)
);
Open the newly created JMP Live report in the browser (you may not want this if you are running on a schedule).
If( !Is Empty( url ),
	Web( url )
);
Finally, clean up the windows.
Close All (data tables, nosave);
For automatic updates, use the Windows Task Scheduler. As long as the JMP table has been updated with new data, the JMP script will run with the most up-to-date data, flag and create control charts of measures that have excursions, and publish a new JMP Live report that can be monitored by those who need to make decisions. JMP ensures that only those measures that are flagged show up as control charts in the JMP Live report. (Of course, you can always download the data and open it in JMP if you want to do any follow-up analyses.)
I've attached the script to this blog post if you'd like to use it as a model for your own daily reports published to JMP Live.
Process Control Flagging Example JMP Live Sample.jsl