In clinical trials, medical queries are used to group adverse events into medical conditions. An analysis of the risk of the medical queries can unearth potential safety signals. Forest plots displaying the risk measurement for each medical query along with a confidence interval help visually detect these safety signals.
JMP Clinical 8 includes a new Medical Query Risk Report to analyze medical queries with a risk plot that includes up to four tables of counts and percentages. The report adds to the existing SMQ Distribution and Incidence Screen reports.
General Options
A new, more flexible option for selecting the treatment or comparison variable is used on the options dialog for the Medical Query Risk Report. Similar to other JMP Clinical reports, Planned, Actual, or Specified Below is chosen as the Treatment or Comparison Variable to Use. However, if Planned or Actual is chosen, then the user can choose which planned or actual treatment variable to use, such as Description of Planned Arm. The values from the chosen variable are then used to populate the Placebo or Comparator Value option. Placebo is the default for this option if it exists as a treatment group.
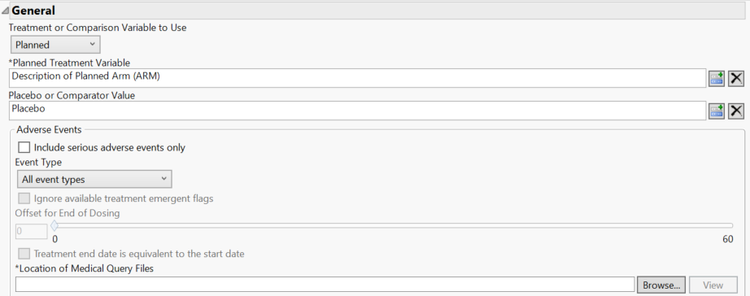
Other options in the general section allow the user to set parameters to determine which adverse events to include and to set the location of the folder where the medical query files live. The most commonly used medical query files are for standardized MedDRA queries (SMQs). More information is available on these at the Medical Dictionary for Regulatory Activities (MedDRA) website.
Risk Plot
The first section of the report, the risk plot, allows the user to visually analyze the incidence of medical queries. The medical queries are shown along the y-axis and are grouped along the x-axis by scope (narrow or broad). The left panel of each scope displays the percent occurrence of each medical query and is colored by treatment group. The right panel of each scope displays the risk measurement along with the 95% confidence interval.

To the side of the risk plot is a medical query report filter that subsets the plot and tables to the medical queries selected.
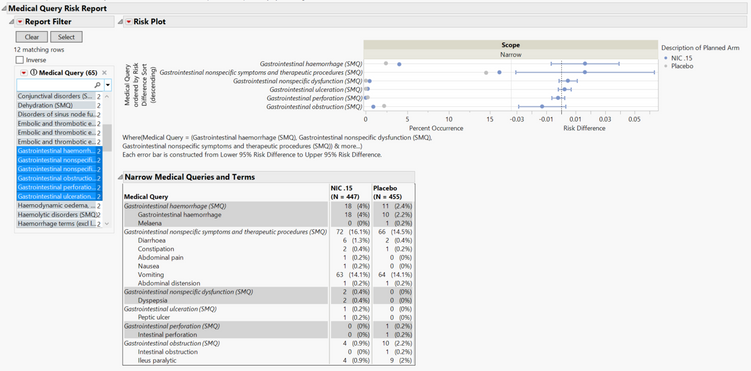
On the options dialog, the user can select Broad to run the report on both broad and narrow medical queries or Narrow to run the report only on narrow medical queries. Narrow queries are for events highly likely to represent the condition, while broad queries are for all possible cases that could be related to the condition. The user can also pick whether to display risk difference, relative risk, or odds ratio as the risk measurement on the plot by using the risk measurement drop-down menu.

The plot can be sorted using the options under “Sort plot and tables by.” If Risk Measurement is selected, then the “Treatment Value for Sort by” option is enabled. For studies with more than two treatment groups, this option allows the user to sort the plot by one of the treatment groups. If no value is picked for this option, then the sum of the risk measurements is used for sorting. If Count is selected as the sorting variable, then the plot and tables are sorted by the total count of events across treatment groups. If Alphabetical is selected, the plot and tables are sorted alphabetically by the medical query name, dictionary-derived term, or system organ class.

Medical Query Tables
The report displays up to four tables, Narrow Medical Queries and Terms, Broad Medical Queries and Terms, Medical Queries, and System Organ Class.
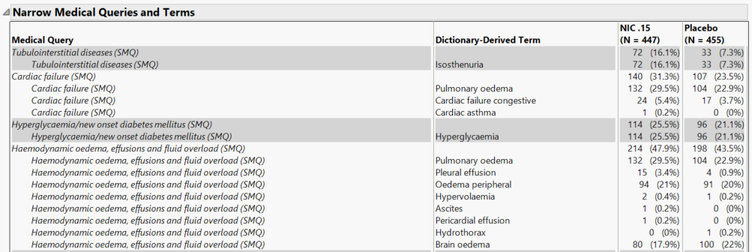
The Narrow Medical Queries and Terms table presents the narrow medical query name in italics with the dictionary-derived terms contributing to the query indented underneath. Counts and percentages are displayed for each query and term by treatment group.

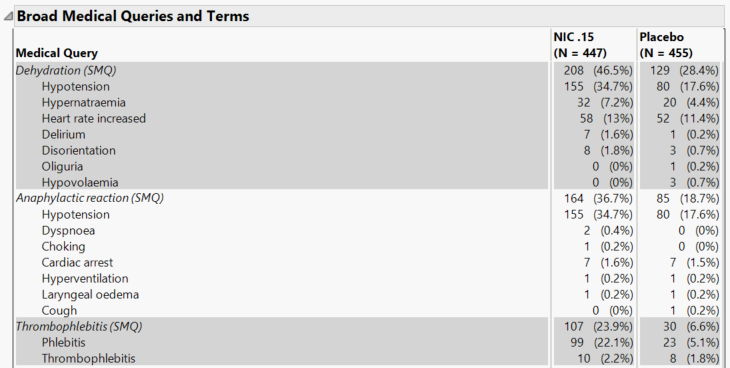
The Broad Medical Queries and Terms table similarly shows the broad medical query name with the contributing dictionary-derived terms. This table appears when Broad search is selected as the scope on the options dialog.
The Medical Queries table displays another view of the counts and percentages for all the medical queries by scope.

If “Run Report with System Organ Class” is checked on the options dialog, then the System Organ Class table appears. Each body system or organ class is shown on a row and the medical queries contributing to the system organ class are indented underneath in italics. The medical queries are ordered by scope under each system organ class.
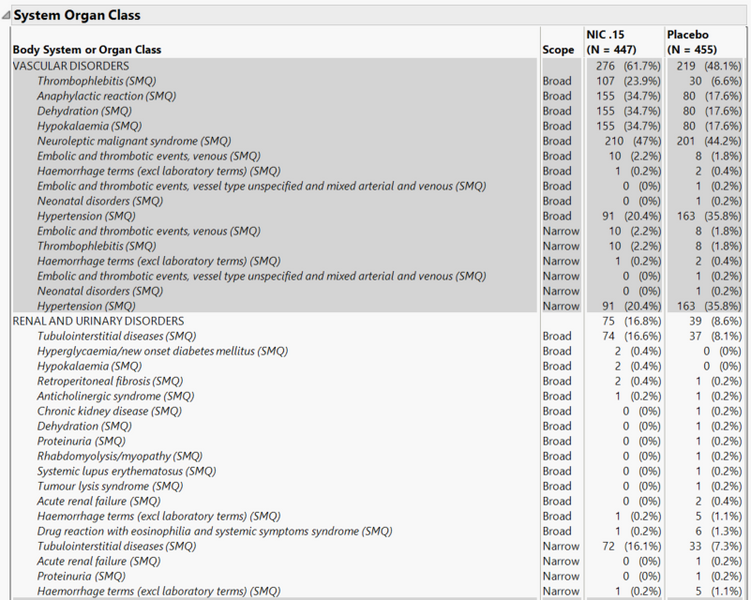
If “Use System Organ Class from SMQ Files” is checked, then the coded terms for system organ class will be taken from the medical query files rather than from the adverse events data set.
Lastly, if the “Show Medical Queries/Dictionary-Derived Terms in separate columns” option is checked, then the Narrow Medical Queries and Terms table and the Broad Medical Queries and Terms table will display the medical queries in the first column of the table and the dictionary-derived term in the second column. This option also splits the system organ class and medical query into two columns in the System Organ Class table.
By using the plot and tables from the Medical Query Risk Report, the user gains a better understanding of the safety data, especially when combined with the other SMQ and adverse event reports presented in JMP Clinical 8.
You must be a registered user to add a comment. If you've already registered, sign in. Otherwise, register and sign in.