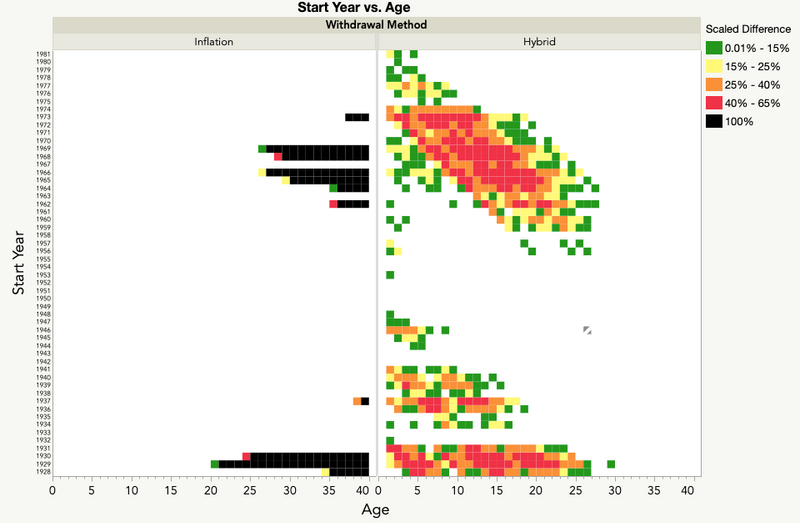
Previously, we looked at altering how we withdrew from a retirement balance to keep from running out of money, what we called the Hybrid method. If the balance divided by the years left in the retirement horizon were less than the scheduled withdrawal amount, we would use this amount. While this guaranteed the balance to stay above zero until, possibly, the very last year, we found that for some historical scenarios, we were left withdrawing an amount far less than we planned, in some cases 40 – 65% less. Reductions even occurred in situations where it was ultimately not necessary.
 Difference between planned and actual withdrawals by retirement year, withdrawal method, and years retired
One thing we could have better clarified in our previous post was the difference between the two approaches relative to their total payout over the entire retirement horizon. These are the same values shown above summed over all periods. Consider this value akin to years lost income. The ideal value is zero which indicates no difference between planned and actual withdrawals. From the graphs below, you can see that while the Inflation approach produced shortfalls of greater than 10 years in six cases (29, 30, 65, 66, 68, and 69), for 45 of the 55 years the difference was zero. The Hybrid approach only showed a zero difference for ten of the years. In 14 cases, the difference was between 5 and 11.6 years.
 Years lost income – Inflation approach
 Years lost income – Hybrid approach
Looking at the difference between the two methods (Years Lost Hybrid – Years Lost Inflation) shows the Inflation method to have favorable results.
 Years lost income – Difference between approaches
This leaves us with a dilemma. Is it better to ensure yearly withdrawals at the planned amount with the potential of running out of funds prematurely or to assure a nonzero balance for the length of the retirement horizon by reducing withdrawals, possibly without need to do so?
Fortunately, we have another approach to consider. Conventional wisdom tells us to have a mix of stocks and bonds in a retirement portfolio. The idea is that while bond returns are historically lower than equities, they are less volatile, softening the blow from market downturns. Here, we look at what would happen if we were to use different mixes of stocks and bonds over the same periods we considered previously. We focus on yearly inflation adjusted withdrawals of 2.5% over a 40-year horizon. We are thankful to Dr. Aswath Damodaran of New York University’s Stern School of Business for letting us use the historical returns of US Treasury Bonds he collected. It is available here.
We started with five different stock/bond mixes: 100/0, 75/25, 50/50, 25/75, and 0/100. The JMP graph below plots the number of years the balance was zero by starting year and mix. We noticed immediately the 50/50 mix produced the best results; the balance did not reach zero for any of the years.
 Years zero balance by Start Year and Stock/Bond mix
Additionally, only nine of the 54 years had an ending balance below 1, with 1937 (0.0589) and 1966 (0.0881) being the worst two.
 Worst ending balances
We reran the analysis looking at mixes between 70/30 and 30/70 stocks/bond in 5% increments. In addition to the 50/50 mix, the 45/55 mix had no zero years. The 55/45 and 40/60 mixes had only one year where the balance reached zero.
 Years zero balance by Start Year and Stock/Bond mix
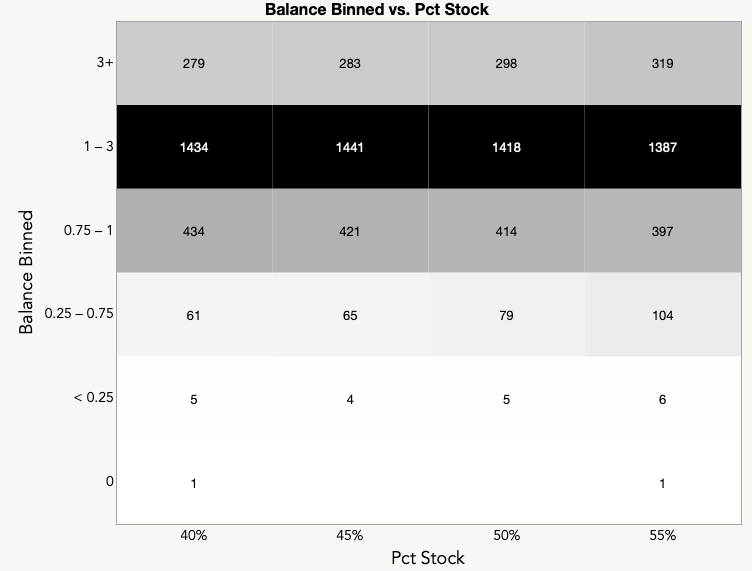
Binning the balances of the 55/45, 50/50, 45/55, and 40/60 stock/bond mixes into five groups (0, <0.25, 0.25 – 0.75, 0.75 – 1, 1 – 3, and 3+, we see few differences.

While looking at historical data is nice, we’d like to be able to generalize to the future. In a future post, we’ll look at using historical information to do this, knowing well that past is not an indicator of future performance.
Explore interactive visuals related to this post at JMP Public, the place to share JMP data visualizations and analyses.
As always, the data sets and scripts used in this post can be found below. If you missed previous posts in our series, you can find them via this "retirement" tag.
Sum of Scaled Difference by Start Year.jmp
Retirement Scenarios (master).jsl
Results - 30 - 70 Pct Mix.jmp
You must be a registered user to add a comment. If you've already registered, sign in. Otherwise, register and sign in.