"Great, you gave us some income numbers, but how long can I expect my nest egg to last?"
That was the main comment/question on my previous blog post regarding what to expect for yearly and monthly retirement income. @DonMcCormack and I (mostly Don) are going to try and answer that question using JMP.
Please keep in mind that this blog post is from two guys who are playing around with some numbers and hoping that what we share with you is helpful as you plan your retirement. We are hoping the same thing for ourselves! As a matter of fact, our data and information is best used as a conversation starter with a licensed financial adviser.
We are going to keep this post simple and to the point based on historical S&P 500 data and associated inflation rates by year. We will share the data, the formulas for calculation and some informational graphs that will hopefully help you sleep better at night knowing an approximate time on when your retirement funds will run out.
As stated in the previous blog post, the financial pundits and experts have touted the 4% withdrawal rule for years; but that percentage rule is starting to shrink to around 3.3%, according to a recent Morningstar report. A quick calculation shows that if you want your nest egg to last you 30 years, you should withdraw your money at 3.3%.
Let's say you have $1,000,000 dollars, and you stuff it under your mattress, and every year you pull out 1/30th (3.3%) or $33,000. That money will last you 30 years. Now consider taking that same amount and investing it, still withdrawing the same amount at the start of each new year. Would you be better or worse off?
To answer this question, we looked at historical yearly returns from the S&P 500. Starting with each year from 1928 to 1990, if you were to have put your money in an S&P 500 indexed fund and withdrew 1/30th at the beginning of each year, would you run out before the end of 30 years or have money to spare? We worked with proportions, so the results would be independent of absolute dollars initially invested. The graph below shows how you would have done starting your retirement on each year. A reference line is drawn at 1, the starting proportion before withdrawing the 1/30th for the first year.
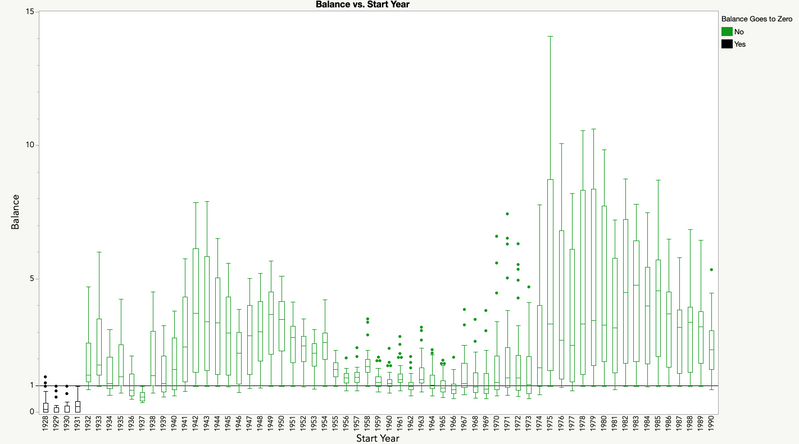
A few things might surprise you. Your account would only run out if you had started withdrawals in one of four years (1928-1931). In over 40% of the cases (26/63), your retirement would not have fallen below 90% of its initial value. For only six years does it ever fall below 50%: the four where it runs out and 1936 and 1937. Nearly half the time (30/63), the residual amount exceeds five times the original amount at some point.
We had a few more fundamental questions. First, what if we were to adjust withdrawals for inflation based on the inflation rate over the previous year? For example, if inflation were 5%, the new withdrawal would be 1.05 times the previous year withdrawal. Likewise, if there were deflation of 5%, we could adjust using 0.95 times the previous year withdrawal.
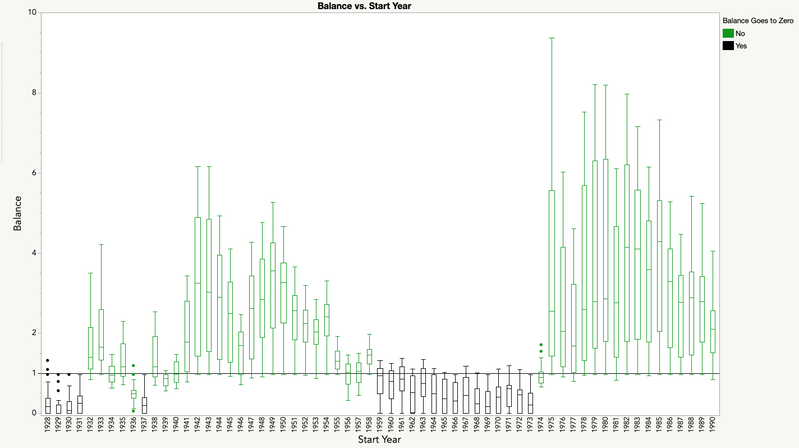
This paints a grimmer picture. In addition to 1928-1931, you would have run out of money for retirements starting on every year during a 15-year period between 1959 and 1973 and the year 1937. The likely culprit is the disastrous back-to-back markets of 1973 (-18.0%) and 1974 (-28.1%). Making matters worse are the high inflation rates in the 1970s and 1980s. During this period, the Consumer Price Index increased 3.37 times, a 6.3% annualized rate, keeping a damper on retirement growth once the market started to take off.
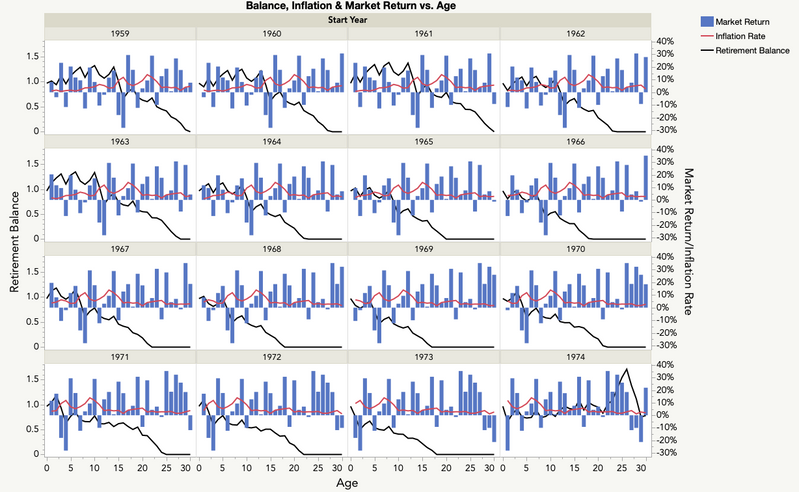
Looking at the graph below, we see that every retirement starting between 1959 and 1973 eventually runs out (the green line). How quickly this happens, though, depends on the amount of equity built up prior to 1973.
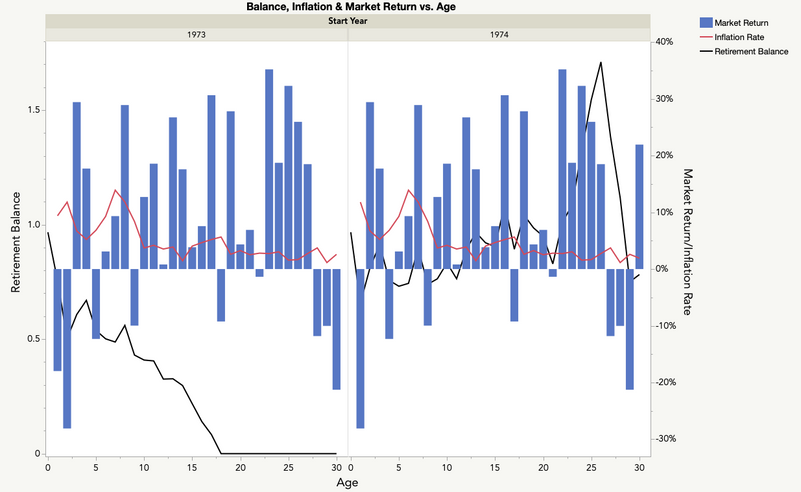
An interesting contrast is between 1973, which goes to zero in year 18, and 1974 that, despite dipping to 65% of its initial value in 1975, stays at or above 75% even after the three years between 2001-2003 when the market lost 11.8, 10.0, and 21.3 percent, respectively. Here, the one-two punch of the 1973 and 1974 market drops dooms 1973 before the market boom that ultimately saves 1974 during the early 2000s.
How much better would you have fared if you decreased your withdrawal rate to 2.5% of your initial retirement? While you would have done much better, there would still be four retirement years after 1930 where you run out of money (1965, 1966, 1968, 1969).

Finally, would this work for a 40-year horizon? In this situation, we can only look through 1982, the last year where we have 40 years of results. It turns out, if you hadn’t run out of money after 30 years, you would have made it another 10 for all but five years (1928, 1931, 1937, 1967, and 1973) for a 2.5% withdrawal rate adjusted for inflation. For the 3.3% adjusted withdrawal rate, 1939, 1940, 1956, 1957, and 1974 are the only retirement years where you would have lasted 30 years but not 40.
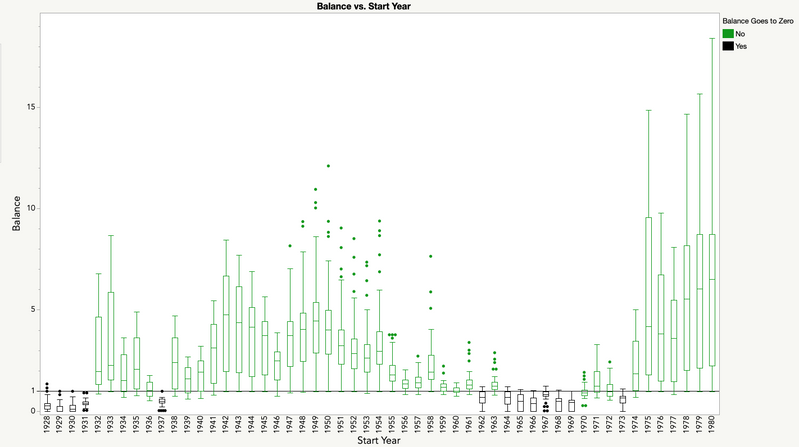 2.5% Withdrawal Rate Adjusted for Inflation
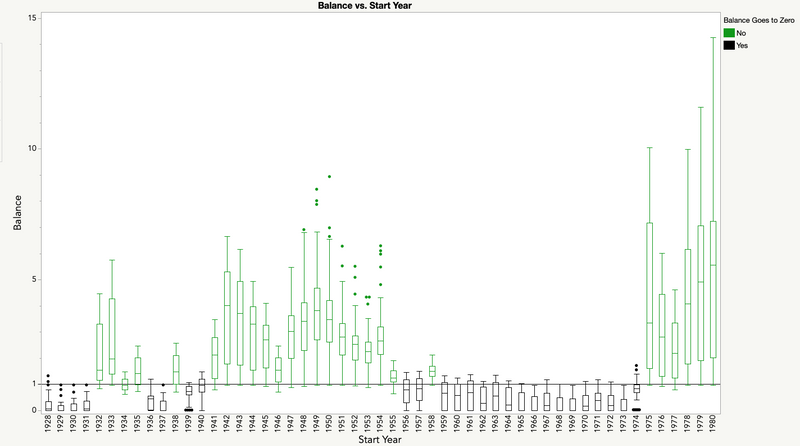 3.3% Withdrawal Rate Adjusted for Inflation
In closing, we want to emphasize that we make no claims to know what the stock market will do over the next 30 or 40 years, and we invite you to dig into the data and the scripts to better understand how we derived our calculations. Another idea to consider is hybrid withdrawal strategies to make certain your money will last the entire 30-40-year period. Watch this space for future posts, and please let us know what you think about this one.
Calculate Historical Returns.jsl
How Long Will it Last v2-2(003).docx
Retirement Investment Historical Results.jmp