JMP Blog
A blog for anyone curious about data visualization, design of experiments, statistics, predictive modeling, and more- JMP User Community
- :
- Blogs
- :
- JMP Blog
- :
- DSUR/PSUR report in JMP Clinical: Assess safety in ongoing clinical trials
- Subscribe to RSS Feed
- Mark as New
- Mark as Read
- Bookmark
- Subscribe
- Printer Friendly Page
- Report Inappropriate Content
When a clinical trial is ongoing, periodic safety updates to regulatory agencies are required. The Development Safety Update Report (DSUR) is used for drugs still under development to assess risk to the subjects enrolled in the study, while the Periodic Safety Update Report (PSUR) is used for drugs already on the market to assess long-term safety. Both reports evaluate adverse events and adverse reactions that occur during the trial, since tracking adverse events is crucial in determining if any serious reactions are related to the study treatment. The reports also include the demographics of the study subjects, whether subjects complete or discontinue the study, why subjects discontinue the study, and exposure to treatment information.
JMP Clinical 8 includes a new DSUR/PSUR report that produces up to five tables and three listings that can be used in these regulatory submissions.
General Report Options
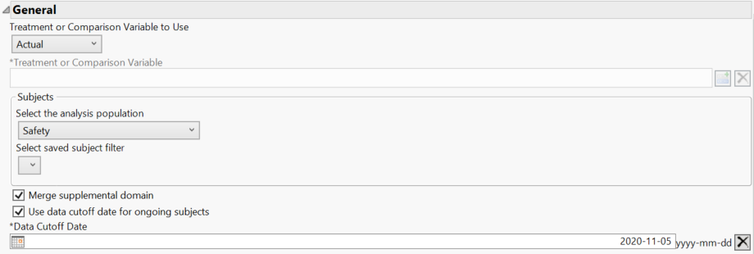
Like other JMP Clinical reports, the DSUR/PSUR report has an options dialog with some general options at the top. The general options allow the user to pick the treatment or comparison variable to use, the analysis population, a saved subject filter, and whether to merge any supplemental data sets. In addition, there is an option to use a data cutoff date for ongoing subjects. In ongoing clinical trials, it is common for exposure end dates to be missing for some subjects who have not completed the treatment regimen. To calculate exposure duration for these subjects, a data cutoff date can be entered in lieu of the exposure end date. The data cutoff date is typically the date the data is pulled from the Electronic Data Capture (EDC) system for the analysis being performed.
Under the data cutoff date, users have a set of checkboxes to designate the tables and listings to include in the results. A total of five tables and three listings can be selected.
At the bottom of the dialog, users can opt for either an RTF or PDF version of the report, set the number of decimal places to use for summary statistics, and decide whether to include rows on the tables for missing values.
Demographics and Baseline Characteristics
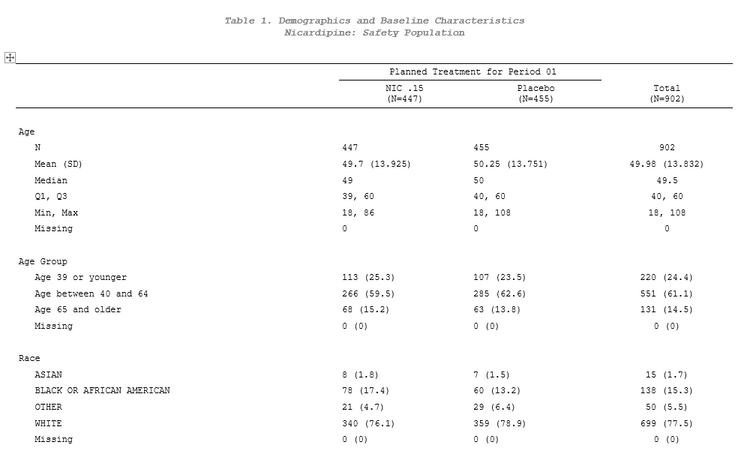
Once the report is run, up to five sections of interactive tables will appear. The first section is for demographics and baseline characteristics, which includes tables for age, age group, race, sex, ethnicity and country. Summary statistics are provided for age, including a missing row if the “Show Counts for Missing Values” option is checked. The other tables display counts and percentages for each treatment or comparison group, as well as a total count and percentage.
The ranges displayed in the age group table can be changed using the option under Demographics for Set Age Groups. Up to five age groups can be specified. If this option is not selected, then the age groups default to “Age 39 or younger,” “Age between 40 and 64,” and “Age 65 and older.”
Disposition of Subjects
The next interactive table is for disposition of subjects, which summarizes the enrolled and randomized populations when available, the subject status, and the reason for discontinuation.
Under the Disposition options, the “Count randomized subjects with no disposition event as ongoing” option adds a row to the disposition table under status for ongoing subjects in addition to those completed and discontinued. If the “Split into treatment and study status based on EPOCH” option is checked, then the disposition table is split into two sections: end of treatment and end of study. When this option is checked, the user can choose which value of EPOCH from the DS data set to use for treatment status and study status. With these options enabled, the table will summarize treatment status, reason for discontinuation from treatment, study status, and reason for discontinuation from study.
Exposure
Part of a DSUR or PSUR submission includes information about exposure to the study drug. Summary statistics are displayed for duration of exposure in days calculated from the first day that the study drug is administered to the last day the study drug is administered for each subject. Counts and percentages are also presented for the route of administration of the study drug.
On the options dialog, there is one option for exposure to indicate that a 0 dose for placebo or vehicle represents a dose interruption.
Adverse Events and Serious Adverse Events
A major part of any DSUR or PSUR report includes an analysis of the adverse events that occur during the clinical trial. Two tables for adverse events are included in the report, one for all adverse events and one for serious adverse events. Both tables display the counts and percentages based on the group and term levels selected in the options.
The term level and group level to be used in the adverse event tables can be chosen using the drop-down menus under the Adverse Events options. The variables chosen in these options also affect which values are displayed in the adverse event listings. Users may also choose to run the adverse event output solely on serious adverse events or on an event type. If treatment emergent is selected as the event type, then users are given the option to ignore available treatment emergent flags. If on treatment or off treatment follow up is selected as the event type, then the offset for end of dosing and treatment end date is equivalent to the start date options become available.
Review Subject Filter and Report Drill Downs
All the interactive tables described above respond to the global subject filter, which can be expanded by clicking on the gray bar on the left-hand side of the review builder. From here, the tables can be subset based on unique subject identifier, study identifier, age, sex, race, treatment group, study site and country. Additional filters can be added by clicking on the AND and OR buttons at the bottom, allowing you to pick other variables from the ADSL or DM data set.
Drilldowns – such as profile subjects, show subjects, adverse events narrative generation and create subject filter – can be run on any selection made within the tables. These drilldowns are available along the top of the report when a selection is made.
RTF and PDF Reports
At the top of the report, a link is displayed to open the report as either an RTF or a PDF.
These reports will display all the tables and listings selected in the options. The tables in the RTF and PDF reports display the same information as the interactive tables. The listings include one for subjects who died, one for adverse events leading to discontinuation of study treatment, and one for serious adverse events related to study treatment.
The first page of the RTF report is a table of contents, making it easier to navigate the document. To enable the table of contents, simply right-click on the first page and select Update Field. The table of contents appears and can be navigated to any of the tables or listings with Ctrl + Click.
With the new JMP Clinical 8 DSUR/PSUR report, the output needed for periodic safety updates can be generated quickly and efficiently, with the added bonus of interactive tables that are not normally available for this type of analysis.
- © 2026 JMP Statistical Discovery LLC. All Rights Reserved.
- Terms of Use
- Privacy Statement
- Contact Us


You must be a registered user to add a comment. If you've already registered, sign in. Otherwise, register and sign in.