JMP Blog
A blog for anyone curious about data visualization, design of experiments, statistics, predictive modeling, and more- JMP User Community
- :
- Blogs
- :
- JMP Blog
- :
- DOE-ing Myself: Run in the morning and wear short shorts
- Subscribe to RSS Feed
- Mark as New
- Mark as Read
- Bookmark
- Subscribe
- Printer Friendly Page
- Report Inappropriate Content
My running design of experiment (DOE) is in the books. It was a lot of fun, and I learned a lot about DOE, myself, and how the JMP community at-large is so fun and engaging. Just finding this blog for the first time? Catch up with a description of the experimental setup and recap of weeks one and two.
Before I get to the results, I’d like to express to all you readers how absolutely fun this project has been. Learning more about myself has been insightful, and being incredibly attentive to every feeling about every run has given me much food for thought. Above and beyond all that, I have loved how much interaction this has garnered. It has been so much fun answering questions about my thought process, taking and applying feedback, and getting all the fan/hate mail about my two-inch shorts. If nothing else, I have learned that those shorts are loved or reviled — there is simply no in-between.
Trigger warning: There is a brief glimpse of my short shorts in this video.
In case you need a refresher about my DOE, there's a full description, including my motivation and experiment setup, below my results. But if you have been following along from the first post and are dying to know the effect of short shorts, your wait is over!
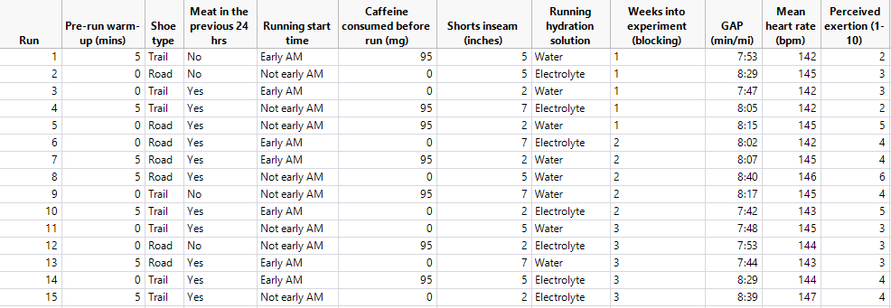
Run Stats
Number of runs: 15
Total distance: 109.6 miles (176.4 km)
Total time: 15 hrs 6 min
Number of catcalls while wearing short shorts: 2 (5 if I count my wife)
Where week 2 was warm and humid, week 3 was cool and dry. While I began to feel the collective fatigue in my legs that comes with ramping up training, overall, I felt faster and more energetic (and the data bear this out).
Results: The Take-Home Message
Timing matters! When modeling results based strictly on the controlled DOE factors, the most significant factors are ‘Running start time’ (earlier is better), followed by ‘Short inseam’ (shorter is better). If you learn nothing else from me today, it is that you should run early in the morning wearing short shorts. You can thank me later.


What do you think of this result? Let me know in the comments.
This is intriguing and bears additional scrutiny. Running start time is a bit nebulous, I can think of many factors that could play a role in controlling running start time. Let’s unpack this.
Consider the Effects of Uncontrolled Factors
In Central Texas, wild temperature and humidity swings between night and day are common. Throw in a random cold front, and the relationships become even more complex. Having grown up in San Diego, I can also tell you that the sun just feels more intense here. Could these factors be the reason that running start time matters?
Yes! Well, maybe…

Looking at the secondary effects of Feels like temp, Sun exposure, and Short length with Run start time, we see a more complete picture. Now seven variables have a PValue >0.1. So fascinating!
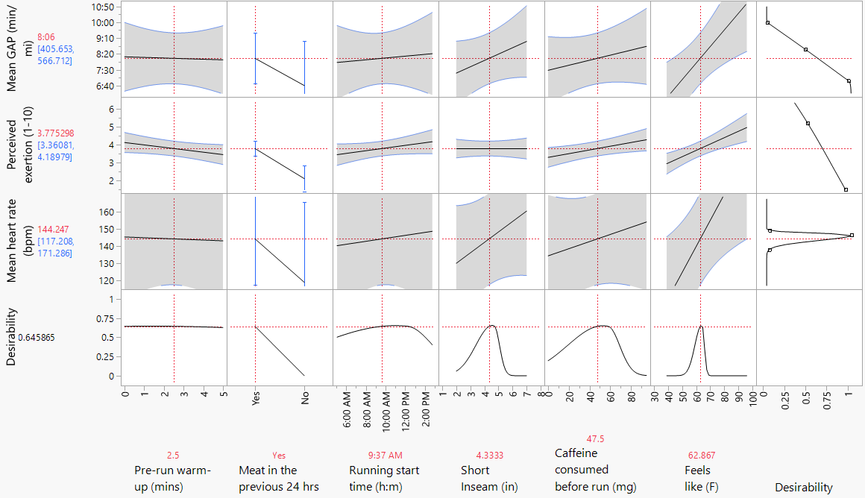
However, when examining the Prediction Profiler, I see that the model is predicting that more sun equates to faster running. Intuitively, I know this is false. Why could this be? I’m blaming a lack of data — there were only two runs in this study with sun exposure >50%.
Let’s re-run the model dropping sun exposure and, at the same time, drop variables with a PValue>0.3, to reduce noise.

This is quite amazing. This tells me running is as much about the environmental factors outside the body as within. Timing, weather, and consumption (meat and coffee) exert the most leverage on the responses.
How well does this model predict responses? OK…

Uncertainty is substantial, and apparently if I become a vegetarian, I could clock sub 6-minute miles. It seems to me more controlled runs are necessary, but this is a heckuva start and has pulled back the veil on a fairly nebulous process.
Next: It's Your Turn
I’ll be honest: I want to take a break from controlling my running so tightly. So I’ll ask, how about you craft your own DOE? What is your passion? Maybe it’s not running. Maybe it’s baking or swimming or knitting. Whatever your passion is, DOE is a great and fun way to learn more about yourself, among many other things.
Stay tuned for future posts about data collection and methods for analysis and different ways to present and/or visualize your exercise data.
Motivation
A little about why I did this: I’m in my mid-30s, and despite being relatively healthy all my life, I had become increasingly sedentary. After taking a family hike and being winded on relatively flat ground, I knew a change was necessary. That day, I went for a run. Over the ensuing year, I slowly warmed to the idea of running, became hooked on trail running, ran an ultramarathon, and welcomed our fourth child into the world. Running has become a great joy and racing the primary motivation to wake up in the 4 o’clock hour and run 20 miles. With my wife, four kids, a career, etc., finding the time to train is difficult. Enter design of experiments. I wanted to know: Can I use DOE to find a more efficient way to train?
DOE Setup
For those unfamiliar with DOE, it is a method to systematically vary a series of factors (inputs) and monitor the ensuing responses (outputs). After entering the factors and their respective ranges, doing the same for the responses, and completing the runs, I used JMP to combine that information into a predictive model. My hope was that, upon completing this DOE, I would have a better understanding of how seemingly inconsequential decisions I make (for instance, which running shoes I wear) affect how fast I run.
Factors, Responses and Controls
There are two categories of variables in this DOE: controlled and uncontrolled. The controlled variables are variables I explicitly outlined in the DOE above and were systematically varied across my 15 runs. Uncontrolled variables are variables that I believed were important but ones I could not explicitly control and/or vary systematically, for example, temperature. A full description of these variables is in the week one and two summaries.
Factors (inputs)
- Warm up — a five-minute warm up on a rowing machine (I never warm up)
- Caffeine — drinking coffee right before my run (I prefer my coffee after I run)
- Timing of run — first thing in the morning or afternoon (I love morning runs)
- Shoes — trail or road shoes (usually it's road on road and trail and trail)
- Diet — did I eat meat in the previous 24 hours? (I was very curious if this has an effect)
- Running hydration — water or electrolyte (prefer water)
- Apparel — 7”, 5”, or 2” inseam shorts*
*A fellow JMP Systems Engineer (and ultramarathoner) and I had a pet theory that shorter shorts make you run faster. It was time to prove this theory once and for all.
Uncontrolled factors
- Weather (temperature, humidity, cloud cover, and heat index)
- Sleep (time in bed and time asleep)
- Additive effect of running 5x per week. This was captured as a blocking value to account for this.
Responses (outputs)
- Grade adjusted pace (GAP) — pace adjusted for changes in grade/slope.
- Heart rate — average heart rate of the entire run
- Perceived effort — 1-10 subjective score of how I felt after each run
Controls
I didn’t have the capacity and certainly not the will to run an identical route 15 times in three weeks, so how did I control for variations in runs? Great question! I am glad you asked.
The best method I could come up with to "normalize" the runs relative to each other was to try to run them in the same manner. To accomplish this, I attempted to finish each run with a mean heart rate of 144 bpm. I went as far as to run faster downhill and slower uphill; in general, despite intrarun variations, I was able to get within 1-2 bpm of this goal despite variations in routes and run distance.

Note: Due to weather and my own stupidity, respectively, runs 10 and 13 became ‘Yes’ to ‘Meat in the previous 24 hrs.’
Thank you all for accompanying me on this journey. I would love to hear your thoughts on how this went, ideas to drill deeper with different types of analyses, and thoughts on next steps. I hope you enjoyed this read as much as I’ve enjoyed this project!
You must be a registered user to add a comment. If you've already registered, sign in. Otherwise, register and sign in.
- © 2026 JMP Statistical Discovery LLC. All Rights Reserved.
- Terms of Use
- Privacy Statement
- Contact Us
