cancel
Showing results for 
Show  only  | Search instead for 
Did you mean: 
Try the Materials Informatics Toolkit, which is designed to easily handle SMILES data. This and other helpful add-ins are available in the JMP® Marketplace
Choose Language Hide Translation Bar
View Original Published Thread

Solve the quality problem fundamentally? Deconstruct the quality control secrets behind manufacturing!

In modern manufacturing, stable quality control is crucial to an enterprise's competitiveness. As manufacturing processes become increasingly complex, traditional methods alone are no longer able to effectively identify hidden quality issues. To solve this challenge, advanced data analysis tools have become a powerful tool for quality engineers.


This article will actually explore an industrial case—how to solve complex quality problems through analytical methods and tools, covering the entire process from preliminary data exploration to final decision-making.

Problem background

A manufacturing company discovered during the manufacturing process that the quality of two key raw materials (Compound 1 and Compound 2) fluctuated greatly, affecting the consistency and reliability of the product. Preliminary analysis shows that this fluctuation may be related to differences in the production processes of raw material suppliers. How to find out the root causes of quality fluctuations and formulate corresponding control strategies is the current core issue.

In order to understand the problem in depth, the team decided to conduct a multi-angle analysis of the data, including the following four levels:

  1. Control charts monitor raw material quality : evaluate whether there are fluctuations caused by special reasons.
  2. Supplier comparative analysis : Identify the process differences of different suppliers and their impact.
  3. Process capability assessment : Measures the stability and suitability of the production process.
  4. Multivariate statistical analysis : looking for potential relationships between multiple variables.

Check normal distribution before analysis

Before analyzing the data, the team realized that many quality tools assume that the data comes from a normal distribution. If this assumption is not met, results based on mean and standard deviation will not be meaningful. Therefore, the team confirmed through distribution analysis that the data of Compound 1 and Compound 2 conformed to the normal distribution.

undefined

Figure 1: Checking for normality

Control charts and process stability

undefined

Figure 2 : control chart


The team uses control chart tools to further analyze quality issues. The control chart delimits the range through the upper limit (UCL), center line and lower limit (LCL), which is used to distinguish ordinary variation from special variation. Actions are often required to eliminate idiosyncratic variations while quantifying common variations to determine process capability.

In a control chart:

  • If the points generated by the process data are randomly distributed within the control limits, it indicates that the process is stable (only ordinary variations exist).
  • If the point falls outside the control limits, it indicates the existence of special variation.

The results show:

  • All points in the XBar chart are within the control limits and randomly distributed, indicating that the process is stable .
  • Batch 10 in the R chart exceeds the control limits and shows special variation .

Process capability index

Cp measures the ratio of the specification range to the width of the process distribution, while Cpk further takes into account the location of the process center relative to the specification limits. Cpk ≥ 1.33 is usually required as the minimum standard.

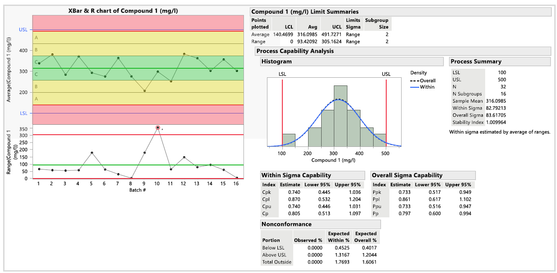
  • Control chart for Compound 1: All points fall within the regulatory limits and the distribution of points is random, indicating that the process is controlled and stable. But the R chart shows that batch 10 is outside the regulatory limits, indicating the presence of some special cause variation. The Cpk value is 0.740 and the Cp value is 0.805, indicating that compound 1 is unstable and has a large range within the group and cannot meet the specifications.

undefined

Figure 3 : Compound 1 Control charts and process capability indicators


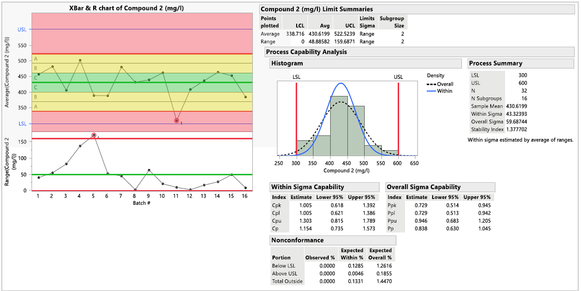
  • Control Chart for Compound 2: The XBar chart shows that Batch 11 falls in the red zone, indicating that the process is uncontrolled and unstable. The R plot shows that Lot 5 is outside the regulatory limits, indicating the presence of some special cause variation. The Cpk value is 1.005 and the Cp value is 1.154, indicating that compound 2 is unstable and cannot meet specifications.

undefined

Figure 4 : Compound2Control charts and process capability indicators

Supplier analysis

After discovering specific process variations for two compounds, the team next focused on exploring these variations from a supplier perspective. Displaying each supplier's control charts side by side helps to visually understand the sources of variation through graphics.

undefined

5: Compounds grouped by supplier 1 and compounds 2 control chart


As can be seen in Figure 5, the results show that Supplier A has greater batch-to-batch variation than Supplier B, but Supplier A is stable for both compounds, while Supplier B shows special variation in Compound 1 cause variation

Model-driven multivariate control charts (MDMVCC)

Use model-driven multivariate control charts to monitor multiple process parameters. This type of control chart is constructed based on principal components or partial least squares models and is used to detect multidimensional instabilities that may be ignored when each dimension is monitored independently. In addition, users can interactively drill down to analyze the contribution of individual variables to the overall signal.

undefined

6:supplier A B Model driven multivariate control charts


As can be seen from Figure 6, the T² value of supplier A is within the control range, but supplier B shows obvious instability in batches 9, 10 and 11.

Process Capability Analysis

Process capability analysis evaluates the performance of a process relative to specification limits. A stable process should always produce products within specifications.

undefined

7:supplier A Compounds 1 and compounds 2 Process capability detail report


undefined

8:supplier B Compounds 1 and compounds 2 Process capability detail report


undefined

圖9: supplier A Compounds 1 and compounds 2 Goal Plotand process performance graphs

圖10: supplier B Compounds 1 and compounds 2 Goal Plotand process performance graphs


Observations

  • Both compounds from Supplier A are within specifications, but the process capability is poor, and there is no significant difference between long-term and short-term variation.
  • Supplier B's compound 2 is within specifications but has slightly insufficient process capabilities, while compound 1 is within specifications and has better process capabilities than compound 2, but it seems that the long-term variation and short-term variation are significantly different.

Decision making after analysis

After detecting a special cause variation in the raw material, the team decided to take the following actions:

  1. Introducing monitoring tools : It is recommended that suppliers use I&MR charts and multivariable control charts to continuously monitor raw material quality and key process parameters.
  2. Increase detection frequency : Increase the frequency of raw material quality analysis; in order to solve the problem of too slow existing detection methods, develop ultra-high performance liquid chromatography (UHPLC) methods for rapid detection and reduce data bottlenecks.
  3. Optimize the measurement process : Improve the existing measurement program, reduce the error risk caused by high measurement deviation, and lay the foundation for subsequent process automation.
  4. Goal-oriented improvement : Use Goal plot to evaluate overall process stability and capabilities to ensure that all improvement measures focus on core quality goals.

summary

The goal of quality engineers is to achieve manufacturing excellence. Continuously identifying and controlling sources of process variation is an important responsibility of the quality department. By embedding quality control into processes, we not only increase flexibility but also ensure that product and service needs are met.

In particular, this case uses the following JMP main functions to help you identify the variability of different materials through data analysis, including but not limited to:

  • Distribution can intuitively display data distribution, as well as multiple quality and process platforms,
  • Control Chart Builder can help you intuitively understand the source of variation
  • MDMVCC multivariate control charts can be used to monitor multiple process parameters
  • The Process Capability platform analyzes process capabilities and stability, and uses Goal Plot and process performance charts to combine variation with capabilities. It is suitable for scenarios that require monitoring of a large number of processes.

If you want to apply scientific statistical analysis and tools, this case provides a systematic solution to complex quality problems. Throughout the entire process, Statistical Program Control (SPC) and Process Capability Analyze played a key role in helping the team effectively identify special causes of fluctuations and optimize the production process.

Achieving excellent manufacturing quality requires continuous process optimization and quality monitoring. By building a stable and high-capacity production process, we can not only reduce product failure rates, but also significantly enhance the company's market competitiveness.


If you are also looking for a quality management solution that suits you, you may wish to click on the following link to obtain more learning resources:

This post originally written in Chinese (Traditional) and has been translated for your convenience. When you reply, it will also be translated back to Chinese (Traditional).