You can annotate the output from your Graph Builder by selecting from the tool bar the Text Box input:
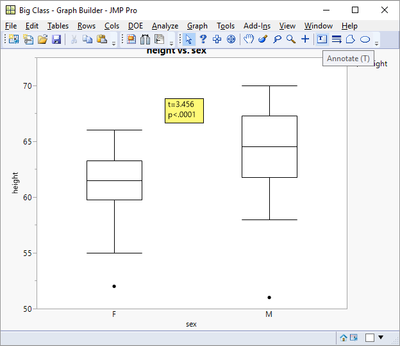
If you are asking if this can be automated, the answer is also yes, through a script.
Names Default To Here( 1 );
dt = Open( "$SAMPLE_DATA\big class.jmp" );
ow = Oneway( Y( :height ), X( :sex ), t Test( 1 ) );
tratio = (Report( ow )["t Test"][Number Col Box( 3 )] << get)[1];
pvalue = (Report( ow )["t Test"][Number Col Box( 4 )] << get)[1];
Graph Builder(
Size( 528, 447 ),
Show Control Panel( 0 ),
Variables( X( :sex ), Y( :height ) ),
Elements( Box Plot( X, Y, Legend( 4 ) ) ),
SendToReport(
Dispatch(
{},
"Graph Builder",
FrameBox,
Add Text Annotation(
Text( "t="||format(eval(tratio),"Fixed Dec",8,4)||"\!np<"||format(eval(pvalue),"pvalue",4)),
Text Box( {200, 64, 261, 103} )
)
)
)
);
Jim


