- Learn how to build custom Python data connectors and further customize JMP’s Data Connector Framework with the Python Data Connector Demo, available now in the JMP Marketplace!
- See how to create experiments to support product design and ID useful product features. Register for June 12 webinar, 2pm US Eastern Time.
- Subscribe to RSS Feed
- Mark Topic as New
- Mark Topic as Read
- Float this Topic for Current User
- Bookmark
- Subscribe
- Mute
- Printer Friendly Page
Discussions
Solve problems, and share tips and tricks with other JMP users.- JMP User Community
- :
- Discussions
- :
- Re: paneling multiple bar charts vertically with same categorical x-axis

- Mark as New
- Bookmark
- Subscribe
- Mute
- Subscribe to RSS Feed
- Get Direct Link
- Report Inappropriate Content
paneling multiple bar charts vertically with same categorical x-axis
so i want something like this: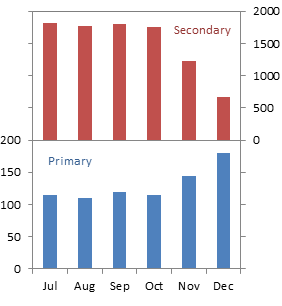 i'd prefer all the y-axis values to be on the same side and each y-axis is a seperate column of data and labeled seperately using the header of that column. the x-axis is categorical and the same for all panels. any ideas?
Accepted Solutions

- Mark as New
- Bookmark
- Subscribe
- Mute
- Subscribe to RSS Feed
- Get Direct Link
- Report Inappropriate Content
Re: paneling multiple bar charts vertically with same categorical x-axis
Hi Jac,
Have you tried GraphBuilder? If not, here is a quick overview of how to format the data and place the variable in GB:
First the table:

Note that to have the correct order in the sequence of months, you may need to go to Column Properties > Value Ordering
Here is the GB using this table:
- Drag the Month column to the X-axis area
- Drag Data 1 to the Y-Axis area
- Drag Data 2 to the top of the Y-Axis area

- Mark as New
- Bookmark
- Subscribe
- Mute
- Subscribe to RSS Feed
- Get Direct Link
- Report Inappropriate Content
Re: paneling multiple bar charts vertically with same categorical x-axis
Hi Jac,
Have you tried GraphBuilder? If not, here is a quick overview of how to format the data and place the variable in GB:
First the table:
Note that to have the correct order in the sequence of months, you may need to go to Column Properties > Value Ordering
Here is the GB using this table:
- Drag the Month column to the X-axis area
- Drag Data 1 to the Y-Axis area
- Drag Data 2 to the top of the Y-Axis area
Recommended Articles
- © 2026 JMP Statistical Discovery LLC. All Rights Reserved.
- Terms of Use
- Privacy Statement
- Contact Us