- JMP User Community
- :
- Discussions
- :
- interactive plots
- Subscribe to RSS Feed
- Mark Topic as New
- Mark Topic as Read
- Float this Topic for Current User
- Bookmark
- Subscribe
- Printer Friendly Page

- Mark as New
- Bookmark
- Subscribe
- Mute
- Subscribe to RSS Feed
- Get Direct Link
- Report Inappropriate Content
interactive plots
Does anyone have any ideas on how to create interactive reports?
In the report, I want to include graphs with multiple lines in each graph. On the left side of the window, I would like to have a list of the lines. When I click on a line from the list, I want the selected line in the graph to be more prominent, while the remaining lines are faded out.

- Mark as New
- Bookmark
- Subscribe
- Mute
- Subscribe to RSS Feed
- Get Direct Link
- Report Inappropriate Content
Re: interactive plots
They seem to have changed it in JMP18. In JMP17.2 this seemed to work
Names Default To Here(1);

dt = open("$SAMPLE_DATA/Big Class.jmp");

gb_collector = Tab Box(<< Set Style("Horizontal Spread"));

For(i = 1, i <= 3, i++,
	tab = Tab Page Box("",
		gb = dt << Graph Builder(
			Variables(X(:weight), Y(:height), Overlay(:sex)),
			Elements(Points(X, Y, Legend(9)), Line Of Fit(X, Y, Legend(11)))
		)
	);
	tab << Title("Title " || Char(i));
	gb << title(Char(i));
	gb_collector << Append(tab)
);

nw = New Window("",
	gb_collector
);- Mark as New
- Bookmark
- Subscribe
- Mute
- Subscribe to RSS Feed
- Get Direct Link
- Report Inappropriate Content
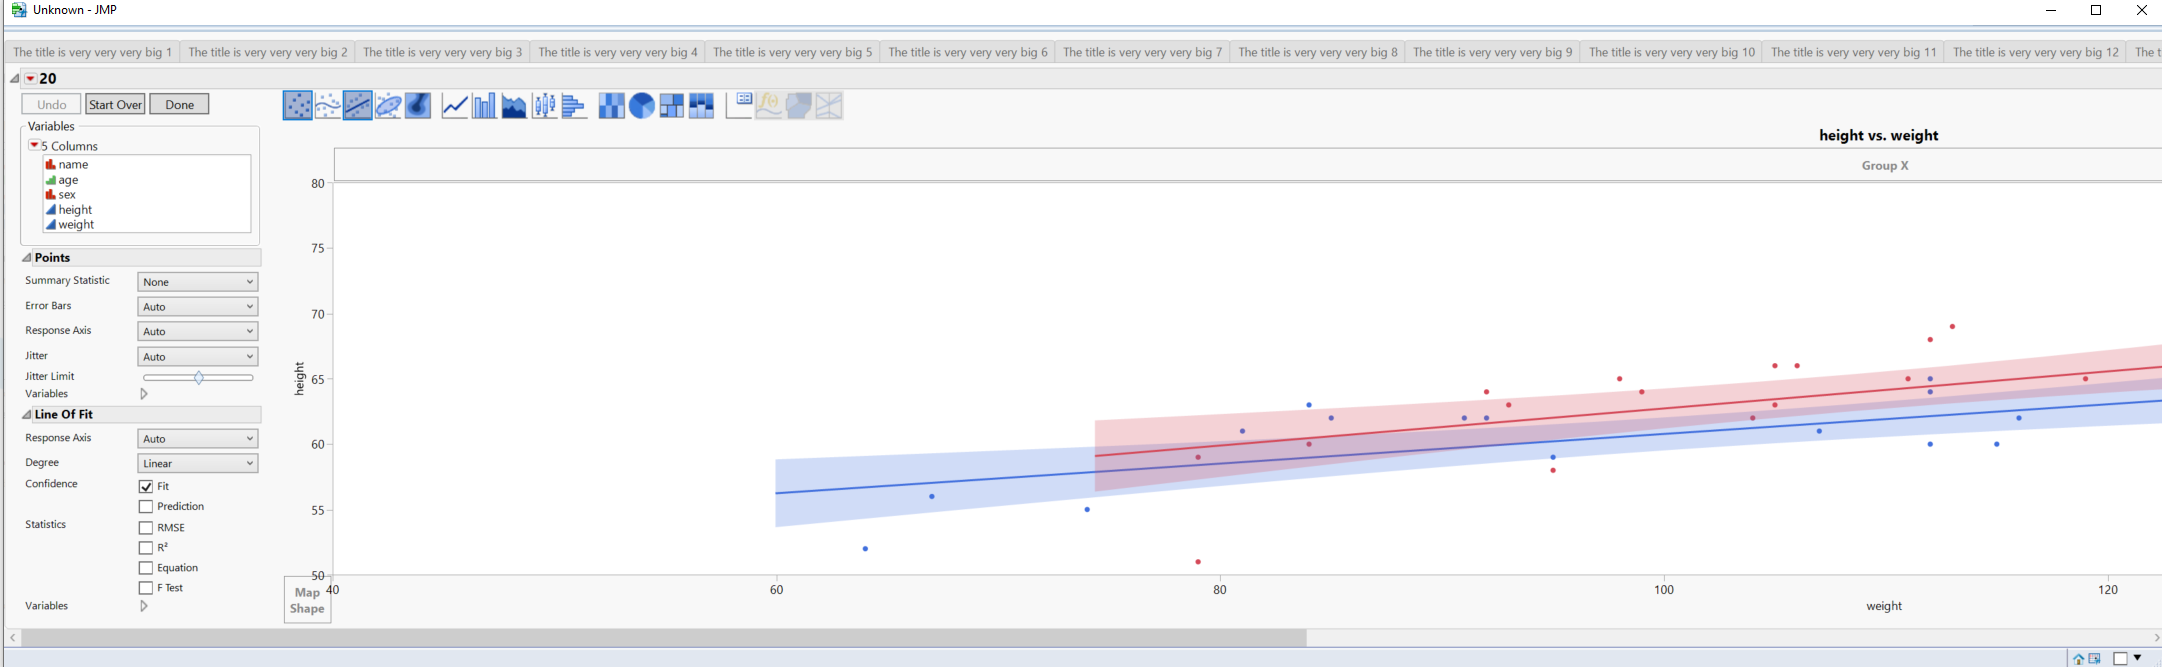
Re: interactive plots
Another issue I would like to address is when I have a large number of tabs (e.g., 20) with lengthy titles, the graphs become disproportionately large, making it difficult to observe them clearly. I would like to resize the graphs to a smaller scale while retaining the large titles and tabs. Is it possible to position the graph on the left with empty space to the right?
- Mark as New
- Bookmark
- Subscribe
- Mute
- Subscribe to RSS Feed
- Get Direct Link
- Report Inappropriate Content
Re: interactive plots
I'm not sure what you mean by "graph on the left with empty space to the right". Create graph manually, resize it a bit, copy script and it will tell you how you can add size to the graph. Tab Box also has overflow and other options which you can find from scripting index

- Mark as New
- Bookmark
- Subscribe
- Mute
- Subscribe to RSS Feed
- Get Direct Link
- Report Inappropriate Content
Re: interactive plots
I am trying to figure out if there is any way to place the graphs like in this screenshot. For example, the first graph first, and then the other two together.
- Mark as New
- Bookmark
- Subscribe
- Mute
- Subscribe to RSS Feed
- Get Direct Link
- Report Inappropriate Content
Re: interactive plots
You can combine for example V List Box, H List Box, Tab Box, Tab Page Box in many different ways to get the layout you want.
You can find quite a lot of information from Scripting Guide https://www.jmp.com/support/help/en/18.0/#page/jmp/construct-display-boxes-for-new-windows.shtml
Names Default To Here(1);

dt = open("$SAMPLE_DATA/Big Class.jmp");

gb_expr = Expr(dt << Graph Builder(
	Show Control Panel(0),
	Variables(X(:weight), Y(:height), Overlay(:sex)),
	Elements(Points(X, Y, Legend(9)), Line Of Fit(X, Y, Legend(11)))
));

nw = New Window("",
	V List Box(
		gb_expr,
		H List Box(
			gb_expr,
			gb_expr
		)
	)
);- Mark as New
- Bookmark
- Subscribe
- Mute
- Subscribe to RSS Feed
- Get Direct Link
- Report Inappropriate Content
Re: interactive plots
Names Default To Here(1);

dt = Open("$SAMPLE_DATA/Big Class.jmp");

gb_collector = Tab Box("Dashboard");

For(i = 1, i <= 20, i++,
// Column box for plot of all batches
	col1 = Col Box("All Batches" || Char(i));

// Create the first Graph Builder plot
	gb = Expr(
		dt << Graph Builder(
			invisible,
			Variables(X(:weight), Y(:height), Overlay(:sex)),
			Elements(Points(X, Y, Legend(9)), Line Of Fit(X, Y, Legend(11)))
		)
	);
	col1 << Append(gb);

// Create a column box for the two Graph Builder plots
	col2 = Col Box("Actual Data " || Char(i));

// Create and append two Graph Builder plots to col2
	For(j = 1, j <= 2, j++,
		gbb = Expr(
			dt << Graph Builder(
				invisible,
				Variables(X(:weight), Y(:height), Overlay(:sex)),
				Elements(Points(X, Y, Legend(9)), Line Of Fit(X, Y, Legend(11)))
			)
		);
		col2 << Append(gbb);
	);

// Create a tab for col1 and col2 and append it to gb_collector
	tab = Tab Page Box(
		" Something Something ",
		V List Box(
			col1,
			H List Box(col2) // Placing the two plots next to each other
		)
	);
	gb_collector << Append(tab);

// Set title for gb
	gb << title("dxfkgbdlk,xfhglihxfd");
);

gb_collector << Dockable(1);
gb_collector << Set Overflow Enabled(1);

nw = New Window("Dashboard", gb_collector);

Trying to use the above example in my script . But i don't get any output. Here is my script:

Current Data Table(dt);
dt << New Column("Time Point Months", Formula(Round(:Time Point Days / 30.438), 2));


gb_collector = Tab Box();

For(i = 1, i <= N Items(numPar), i++,

// Column box for plot of all batches
	col1 = Col Box("");
// Column box for plot of actual data
	col2 = Col Box("");
// Column box for plot of difference
	col3 = Col Box("");

//tab = Tab Page Box("",
	gb = dt << Graph Builder(
//invisible,
		Size(700, 400),
		Variables(X(:Time Point Months), Y(:Result), Overlay(:Batch)),
		Elements(Points(X, Y))
	);

// Local filter: set the batch to only the batches that are in cyc with a ref, not all other batches
	gb << Local Data Filter(
		invisible,
		Add Filter(
			columns(:Component, :Batch, :Source Table),
			Where(:Component == numPar[i]),
			Where(:Batch == {cyc, bat}),
			Where(:Source Table == dt_name)
		)
	);
	dt << Clear Select();
// Remove the filter display from the graph
	gb << Show Control Panel(0);
// Report for changing plot
	gbb = Report(gb)[GraphBuilderBox(1)];
// Add linear regression
	gbb << Add Element(1, 1, {Type("Line Of Fit"), X, Y, Confidence of Fit(0), Equation(0)});

// Set Y axis
	minval = Min(
		:Result[dt << get rows where(
			:Component == numPar[i] & :Batch == cyc & :Source Table == dt_name | :Batch == bat
			 & :Component == numPar[i] & :Source Table == dt_name
		)]
	) * 0.95;
	maxval = Max(
		:Result[dt << get rows where(
			:Component == numPar[i] & :Batch == cyc & :Source Table == dt_name | :Batch == bat
			 & :Component == numPar[i] & :Source Table == dt_name
		)]
	) * 1.05;
	maxvalts = Max(
		:Time Point Months[dt << get rows where(
			:Component == numPar[i] & :Batch == cyc & :Source Table == dt_name | :Batch == bat
			 & :Component == numPar[i] & :Source Table == dt_name
		)]
	) * 1.05;
	gbb[AxisBox(1)] << Min(-0.1);
	gbb[AxisBox(1)] << Max(maxvalts);
	gbb[AxisBox(2)] << Min(minval);
	gbb[AxisBox(2)] << Max(maxval);
	gbb[AxisBox(2)] << inc((maxval - minval) / 10);

// Set Y axis label
	unitList = Associative Array(
		:Result Unit[dt << get rows where(
			:Component == numPar[i] & :Batch == cyc & :Source Table == dt_name | :Batch == bat
			 & :Component == numPar[i] & :Source Table == dt_name
		)]
	) << Remove("") << Get Keys;
	If(N Items(unitList) == 1,
		gbb[Text Edit Box(4)] << Set text(numPar[i] || " [" || unitList[1] || "]"),
		gbb[Text Edit Box(4)] << Set text(numPar[i])
	);


// Set graph title
	gbb[Text Edit Box(1)] << Set text(numPar[i] || " vs. Time Point");
// Append
	//gbba = Report(gb),
	col1 << Append(gb);


//filter << close;
	gb << close window;

// Within the loop through parameters we are now also looping through batches
	For(k = 1, k <= N Items(cyc), k++,
		check = dt << get rows where(
			:Component == numPar[i] & :Batch == cyc[k] & :Source Table == dt_name | :Batch ==
			bat[k] & :Component == numPar[i] & :Source Table == dt_name
		);
		If(N Items(check) > 0, // Create check to see if parameter exist for current batch
			// Create base plot
			gb = Graph Builder(
//invisible,
				Size(700, 400),
				Variables(X(:Time Point Months), Y(:Result), Overlay(:Batch)),
				Elements(Points(X, Y), )
			);
			gb << Local Data Filter(
				invisible,
				Add Filter(
					columns(:Component, :Batch, :Source Table),
					Where(:Component == numPar[i]),
					Where(:Batch == {cyc[k], bat[k]}),
					Where(:Source Table == dt_name)
				)
			);
			dt << Clear Select();


// Remove the filter display from the graph
			gb << Show Control Panel(0);


// Report for changing plot
			gbb = Report(gb)[GraphBuilderBox(1)];

// Add liniear regression
			gbb << Add Element(
				1,
				1,
				{Type("Line Of Fit"), X, Y, Confidence of Fit(0), Equation(0)}
			);

// Set Y axis
			minval = Min(
				:Result[dt << get rows where(
					:Component == numPar[i] & :Batch == cyc[k] & :Source Table == dt_name |
					:Batch == bat[k] & :Component == numPar[i] & :Source Table == dt_name
				)]
			) * 0.95;
			maxval = Max(
				:Result[dt << get rows where(
					:Component == numPar[i] & :Batch == cyc[k] & :Source Table == dt_name |
					:Batch == bat[k] & :Component == numPar[i] & :Source Table == dt_name
				)]
			) * 1.05;
			maxvalts = Max(
				:Time Point Months[dt << get rows where(
					:Component == numPar[i] & :Batch == cyc[k] & :Source Table == dt_name |
					:Batch == bat[k] & :Component == numPar[i] & :Source Table == dt_name
				)]
			) * 1.05;

			gbb[AxisBox(1)] << Min(-0.1);
			gbb[AxisBox(1)] << Max(maxvalts);
			gbb[AxisBox(2)] << Min(minval);
			gbb[AxisBox(2)] << Max(maxval);
			gbb[AxisBox(2)] << inc((maxval - minval) / 10);

// Set Y axis label
			unitList = Associative Array(
				:Result Unit[dt << get rows where(
					:Component == numPar[i] & :Batch == cyc[k] & :Source Table == dt_name |
					:Batch == bat[k] & :Component == numPar[i] & :Source Table == dt_name
				)]
			) << Remove("") << Get Keys;

			If(N Items(unitList) == 1,
				gbb[Text Edit Box(4)] << Set text(numPar[i] || " [" || unitList[1] || "]")
			);

			If(N Items(unitList) != 1,
				gbb[Text Edit Box(4)] << Set text(numPar[i])
			);

// Set graph titel
			gbb[Text Edit Box(1)] << Set text(numPar[i] || " vs. Time Point ");

// Append
			//gbba = Report( gbb );
			col2 << Append(gbb);

//filter << close;
			gb << close window;

// Start second plot
			gb2 = Graph Builder(
//invisible,
				Size(700, 400),
				Variables(X(Time Point Months), Y(:Difference), Color(:Batch)),
				Elements(Points(X, Y))
			);
			gb2 << Local Data Filter(
				invisible,
				Add Filter(
					columns(:Component, :Batch, :Source Table),
					Where(:Component == numPar[i]),
					Where(:Batch == cyc[k]),
					Where(:Source Table == dt5_name)
				)
			);
			dt4 << Clear Select();


// Remove the filter display from the graph
			gb2 << Show Control Panel(0);

// Report for changing plot
			gbb2 = Report(gb2)[GraphBuilderBox(1)];

			gbb2 << Add Element(1, 1, {Type("Line"), X, Y});

// Get the HC value
			l_idx = dt4 << Get rows where(dt4:Component == numPar[i] & :Batch == cyc[k]);
			ul = Min(dt4:HC[l_idx]);

			If(Is Missing(ul),
				If(
					Min(
						:Difference[dt << get rows where(
							:Component == numPar[i] & :Batch == cyc[k] & :Source Table ==
							dt5_name
						)]
					) == 0,
					minval = -5;
					maxval = 5;
				,
					minval = Min(
						:Difference[dt << get rows where(
							:Component == numPar[i] & :Batch == cyc[k] & :Source Table ==
							dt5_name
						)]
					) * 0.95;
					maxval = Max(
						:Difference[dt << get rows where(
							:Component == numPar[i] & :Batch == cyc[k] & :Source Table ==
							dt5_name
						)]
					) * 1.05;
				)
			,
				minval = Min(
					:Difference[dt << get rows where(
						:Component == numPar[i] & :Batch == cyc[k] & :Source Table == dt5_name
					)],
					-ul
				) * 1.05;
				maxval = Max(
					:Difference[dt << get rows where(
						:Component == numPar[i] & :Batch == cyc[k] & :Source Table == dt5_name
					)],
					ul
				) * 1.05;
			);

			If(!Is Missing(ul), //if no HC value dont create limit line
				gbb2[AxisBox(2)] << Add Ref Line(ul, "solid", black, Char(Round(ul, 2)));
				gbb2[AxisBox(2)] << Add Ref Line(-ul, "solid", black, Char(Round(-ul, 2)));
			);

			gbb2[AxisBox(2)] << Add Ref Line(0, "Dashed");
			gbb2[AxisBox(2)] << Min(minval);
			gbb2[AxisBox(2)] << Max(maxval);
			gbb2[AxisBox(2)] << inc((maxval - minval) / 10);

//Append
			//gbba2 = Report( gbb2 );
			col3 << Append(gbba2);

//filter << close;
			gb2 << close window;

		);
	);

//);
	tab = Tab Page Box(
		numPar[i],
		V List Box(
			col1
H List Box(col2, col3) // Placing the two plots next to each other

		)
	);
	tab << Title(numPar[i]);
//gb << title(Char(1));
	gb_collector << Append(tab);

);
gb_collector << Dockable(1);
gb_collector << Set Overflow Enabled(1);


nw = New Window("My dashboard", gb_collector);can you please help me find out how to do it?
- Mark as New
- Bookmark
- Subscribe
- Mute
- Subscribe to RSS Feed
- Get Direct Link
- Report Inappropriate Content
Re: interactive plots
You have to take a step back and explain what you want: in best case provide example data or use one of the JMPs sample datasets to explain what you wish to have in the smallest possible example.
- Mark as New
- Bookmark
- Subscribe
- Mute
- Subscribe to RSS Feed
- Get Direct Link
- Report Inappropriate Content
Re: interactive plots
Names Default To Here(1);

dt = Open("$SAMPLE_DATA/Big Class.jmp");

gb_collector = Tab Box("Dashboard");

For(i = 1, i <= 20, i++,
// Column box for plot of all batches
	col1 = Col Box("All Batches" || Char(i));

// Create the first Graph Builder plot
	gb = Expr(
		dt << Graph Builder(
			invisible,
			Variables(X(:weight), Y(:height), Overlay(:sex)),
			Elements(Points(X, Y, Legend(9)), Line Of Fit(X, Y, Legend(11)))
		)
	);
	col1 << Append(gb);

// Create a column box for the two Graph Builder plots
	col2 = Col Box("Actual Data " || Char(i));

// Create and append two Graph Builder plots to col2
	For(j = 1, j <= 2, j++,
		gbb = Expr(
			dt << Graph Builder(
				invisible,
				Variables(X(:weight), Y(:height), Overlay(:sex)),
				Elements(Points(X, Y, Legend(9)), Line Of Fit(X, Y, Legend(11)))
			)
		);
		col2 << Append(gbb);
	);

// Create a tab for col1 and col2 and append it to gb_collector
	tab = Tab Page Box(
		" Something Something ",
		V List Box(
			col1,
			H List Box(col2) // Placing the two plots next to each other
		)
	);
	gb_collector << Append(tab);

// Set title for gb
	gb << title("Title");
);

gb_collector << Dockable(1);
gb_collector << Set Overflow Enabled(1);

nw = New Window("Dashboard", gb_collector);


Here is the example that i use and i am trying to follow the same structure in my own script.- Mark as New
- Bookmark
- Subscribe
- Mute
- Subscribe to RSS Feed
- Get Direct Link
- Report Inappropriate Content
Re: interactive plots
Here is my script..
Attached is a screenshot of my current dashboard, which contains 8 graphs. Here are my specific requirements for organizing these graphs:
- Keep the First Graph: I would like to retain the first graph as it is.
- Remove the Second Graph: The second graph should be removed from the dashboard.
- Pair the Last Six Graphs: The last six graphs should be paired such that each pair is displayed side by side. Specifically, the graphs should be organized as follows:
- The third and fourth graphs should be displayed next to each other.
- The fifth and sixth graphs should be displayed next to each other.
- The seventh and eighth graphs should be displayed next to each other.
To summarize, the final layout should have the first graph followed by three pairs of graphs, with each pair displayed side by side.
- Mark as New
- Bookmark
- Subscribe
- Mute
- Subscribe to RSS Feed
- Get Direct Link
- Report Inappropriate Content
Re: interactive plots
Those two scripts are totally different (also please use JSL formatting for JSL code it is much easier to read). What are you using Col Box for? What are you looping over (i and j)? What determines what information each of the graphs contains? Should they be interactive with each other?
- « Previous
-
- 1
- 2
- Next »
- © 2025 JMP Statistical Discovery LLC. All Rights Reserved.
- Terms of Use
- Privacy Statement
- Contact Us