cancel
Showing results for 
Show  only  | Search instead for 
Did you mean: 
  • Instantly extract effect sizes, F-ratios, and FDR-adjusted p-values from your models with the Calculate Effects Sizes extension, available now in the JMP Marketplace!
  • New to JMP? Join us Sept. 23-24 for the Early User Edition of Discovery Summit, tailor-made for new users. Register now for free!
  • Use World Cup data to build models, explore spatial relationships, and create informative visualizations in JMP. Register. July 17, 2 pm US Eastern Time.

Discussions

Solve problems, and share tips and tricks with other JMP users.
Choose Language Hide Translation Bar
Abeerosama
Level I

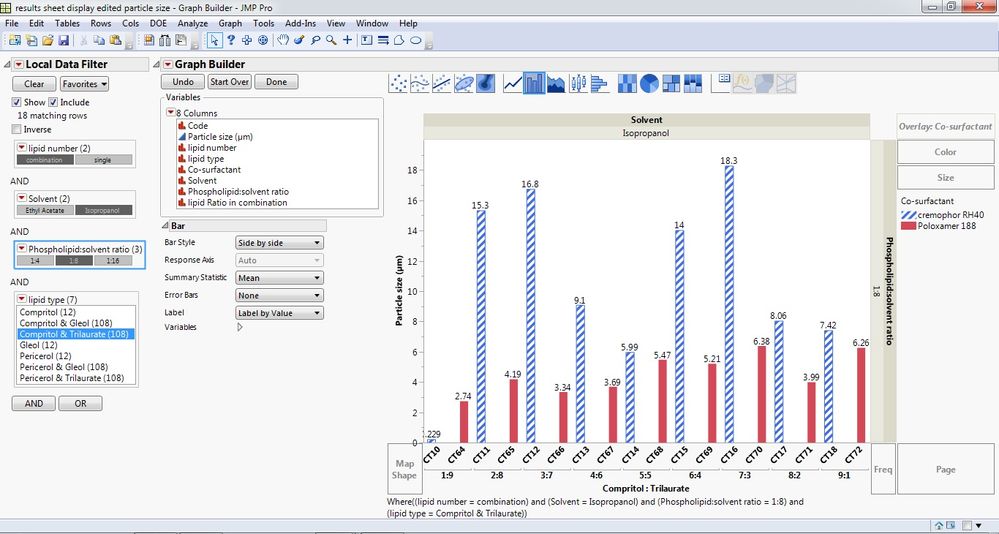
how to decrease the space between bars in the bar chart

I need to know if it's available to decrease the space between the bars

CT10 and CT64     

CT11 and CT65

CT12 and CT66 ... etc 

As each pair of theses are to be compared directly with each other.


bar chart.jpg

Abeer Osama
1 REPLY 1
XanGregg
Staff

Re: how to decrease the space between bars in the bar chart

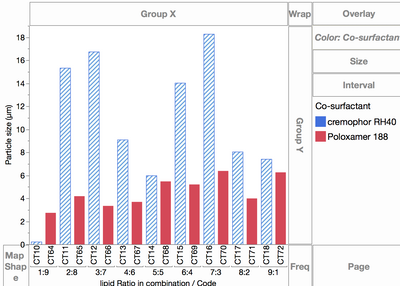
The bars are skinny because it's making room for 4 bars per ratio. It appears the 2 values of the overlay variable are redundant with the 2 active values for each ratio. Graph Builder is making room for the general case of 2x2=4 bars. You will get a better result by putting the co-surfactant variable in the color role instead of the overlay role. There it will merely affect the appearance of the bars rather than the structure of the graph.


Here's the result (kudos for including your picture and data).
solvent.png


Btw, JMP 14 adds explicit control over the bar widths in the Customize dialog from right-clicking on the graph. 



Recommended Articles