- Learn how to build custom Python data connectors and further customize JMP’s Data Connector Framework with the Python Data Connector Demo, available now in the JMP Marketplace!
- See how to use Accelerated Life Testing (ALT) to evaluate reliability. Register for June 5 webinar, 2pm US Eastern Time.
- Subscribe to RSS Feed
- Mark Topic as New
- Mark Topic as Read
- Float this Topic for Current User
- Bookmark
- Subscribe
- Mute
- Printer Friendly Page
Discussions
Solve problems, and share tips and tricks with other JMP users.- JMP User Community
- :
- Discussions
- :
- how to create a line graph with multiple lines at variable time points

- Mark as New
- Bookmark
- Subscribe
- Mute
- Subscribe to RSS Feed
- Get Direct Link
- Report Inappropriate Content
how to create a line graph with multiple lines at variable time points
I am very new to JMP and I have tried searching the discussion board for a solution, but cannot seem to figure this out.
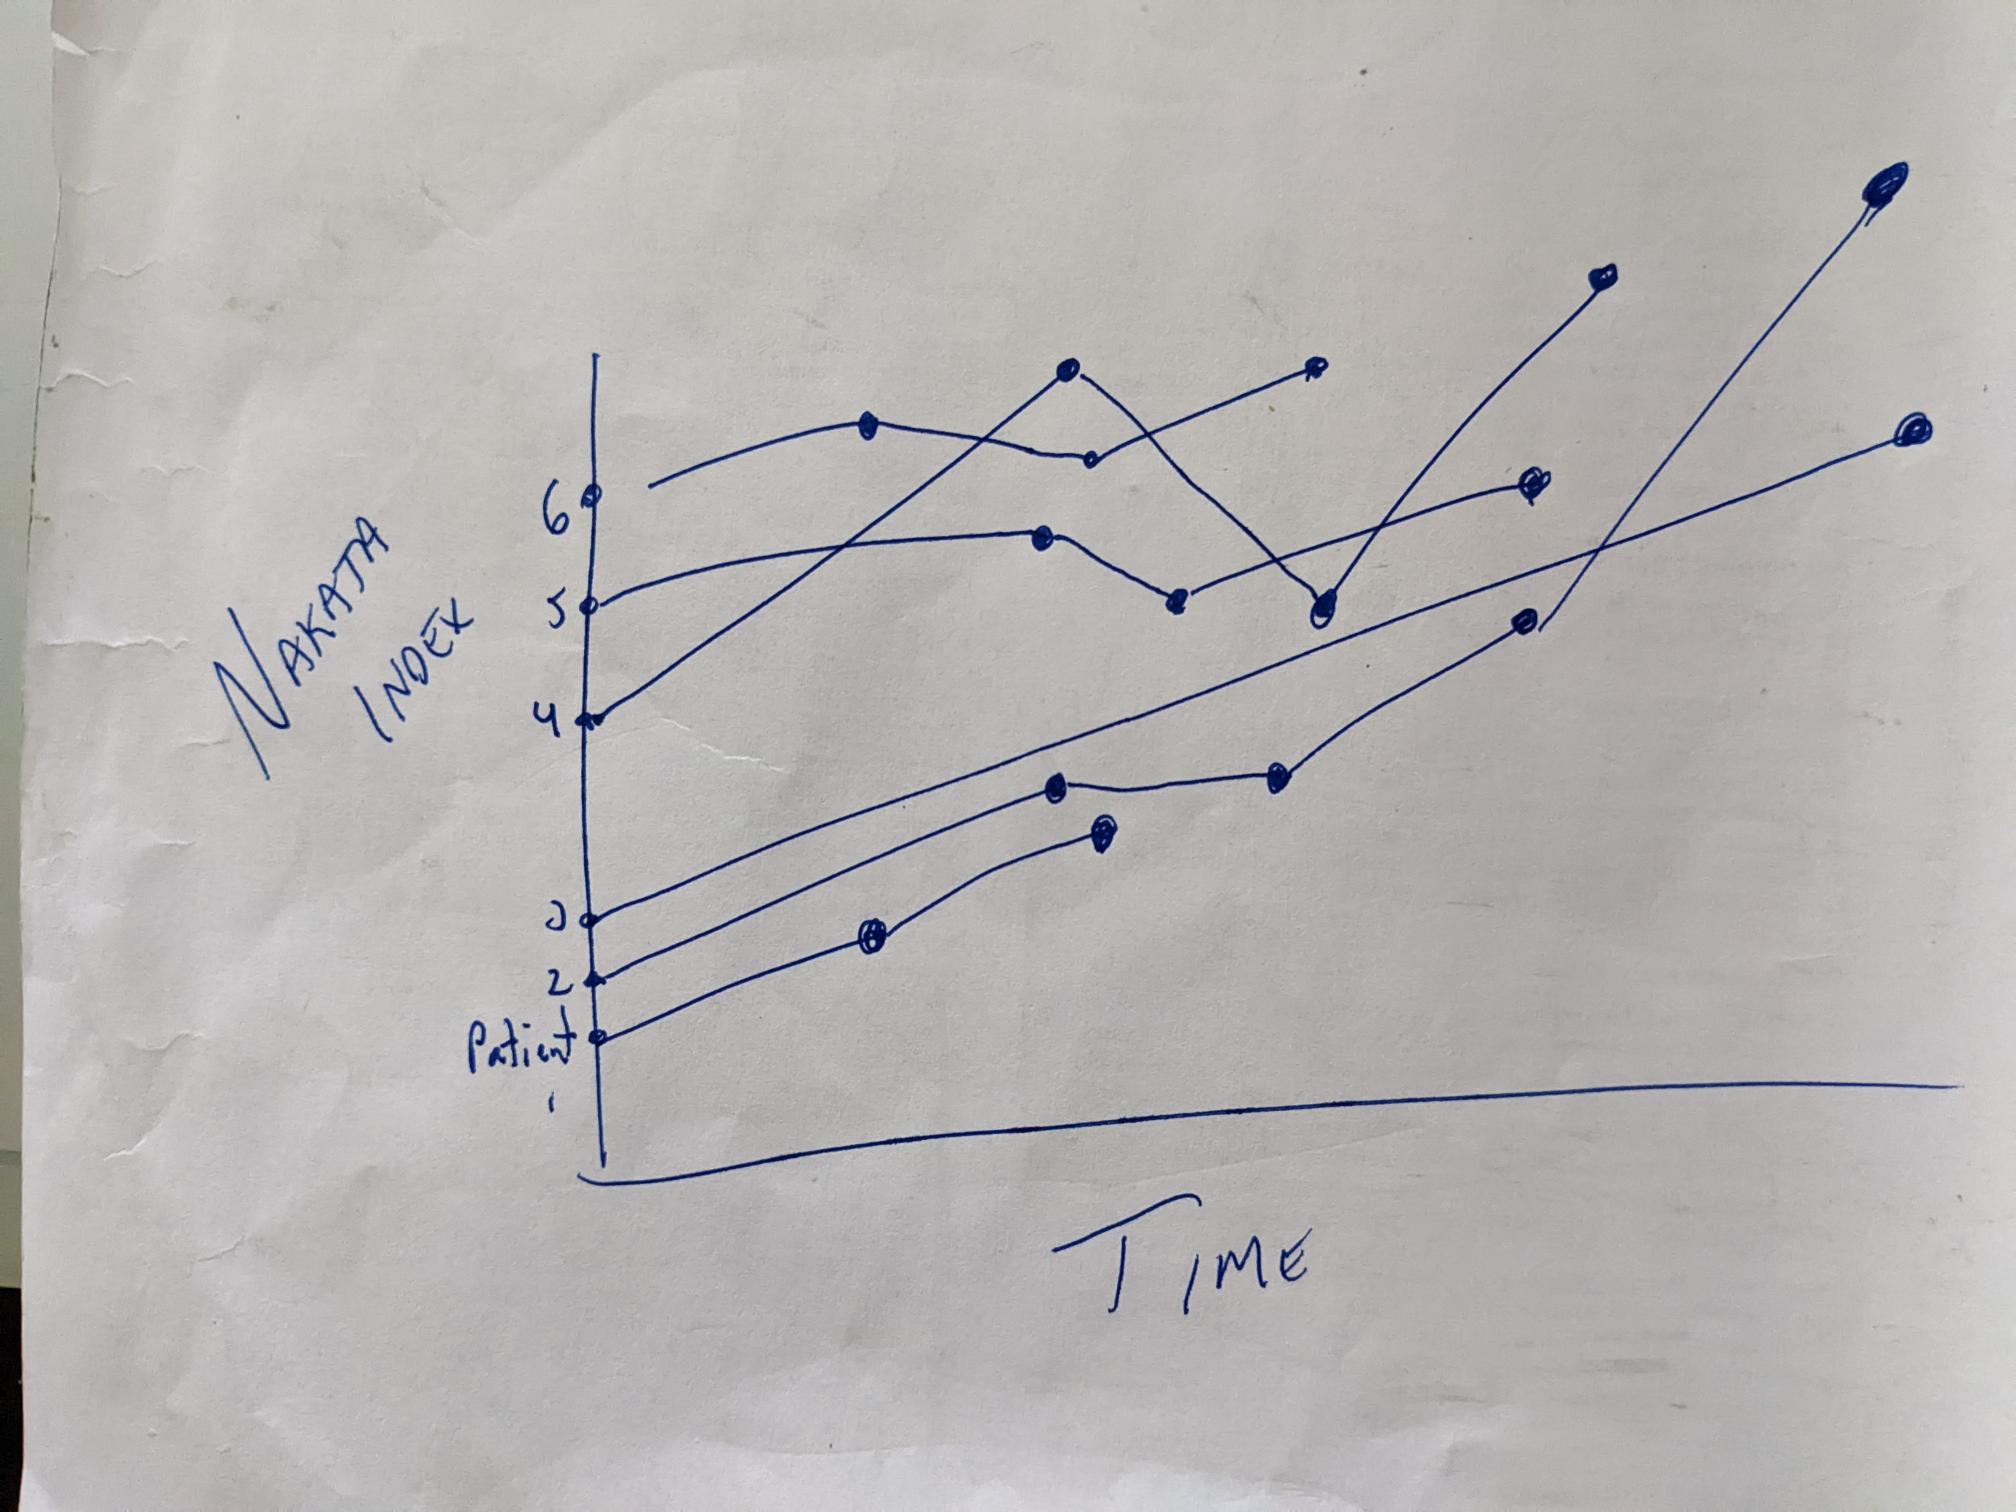
I have data on 23 patients with measurements of a vessel size at 4 varying times points (i.e., the intervals vary between the patients... as opposed to some constant interval for all subjects).
I would like to generate a line graph showing the vessel size for each patient at the measured times (see very rudimentary sketch).
I have attached my JMP data table. I specifically want to graph a line for each patient of Nakata Index 1 at Time 1, Nakata Index 2 at Time 2, Nakata Index 3 at Time 3, and Nakata Index 4 at Time 4. FYI, there are no personal identifying data in the table.
I hope this makes sense. And yes, I understand I am very new and likely making an amateur error but would greatly appreciate any help you can offer!
Thank you
Accepted Solutions

- Mark as New
- Bookmark
- Subscribe
- Mute
- Subscribe to RSS Feed
- Get Direct Link
- Report Inappropriate Content
Re: how to create a line graph with multiple lines at variable time points
This is a fairly easy task
- Using Tables=>Stack do a Multiple Series Sack, .
- stacking the Time 1, Nakata Index 1, Time 2, Nakata Index 2.......etc
- Also keep the Patient column
- In the new stacked data table,
- Change the name of the new column called Data to Time
- Change the name of the new column called Data 2 to Nakata Index
- Change the Patient column from a Continuous Modeling Type to Ordinal
- Open Graph Builder
- Drag the Time column to the X Drop area
- Drag the Nakata Index column to the Y Drop area
- Drag the Patient column to the Overlay drop area
Recommended Articles
- © 2026 JMP Statistical Discovery LLC. All Rights Reserved.
- Terms of Use
- Privacy Statement
- Contact Us