- Instantly extract effect sizes, F-ratios, and FDR-adjusted p-values from your models with the Calculate Effects Sizes extension, available now in the JMP Marketplace!
- New to JMP? Join us Sept. 23-24 for the Early User Edition of Discovery Summit, tailor-made for new users. Register now for free!
- See how to use the JMP Marketplace – Free tools to expand JMP capabilities. Register. July 10, 2 pm US Eastern Time.
- Subscribe to RSS Feed
- Mark Topic as New
- Mark Topic as Read
- Float this Topic for Current User
- Bookmark
- Subscribe
- Mute
- Printer Friendly Page
Discussions
Solve problems, and share tips and tricks with other JMP users.- JMP User Community
- :
- Discussions
- :
- how can I get data table from a graph?

- Mark as New
- Bookmark
- Subscribe
- Mute
- Subscribe to RSS Feed
- Get Direct Link
- Report Inappropriate Content
how can I get data table from a graph?
Hey, I'm using JMP pro 13.
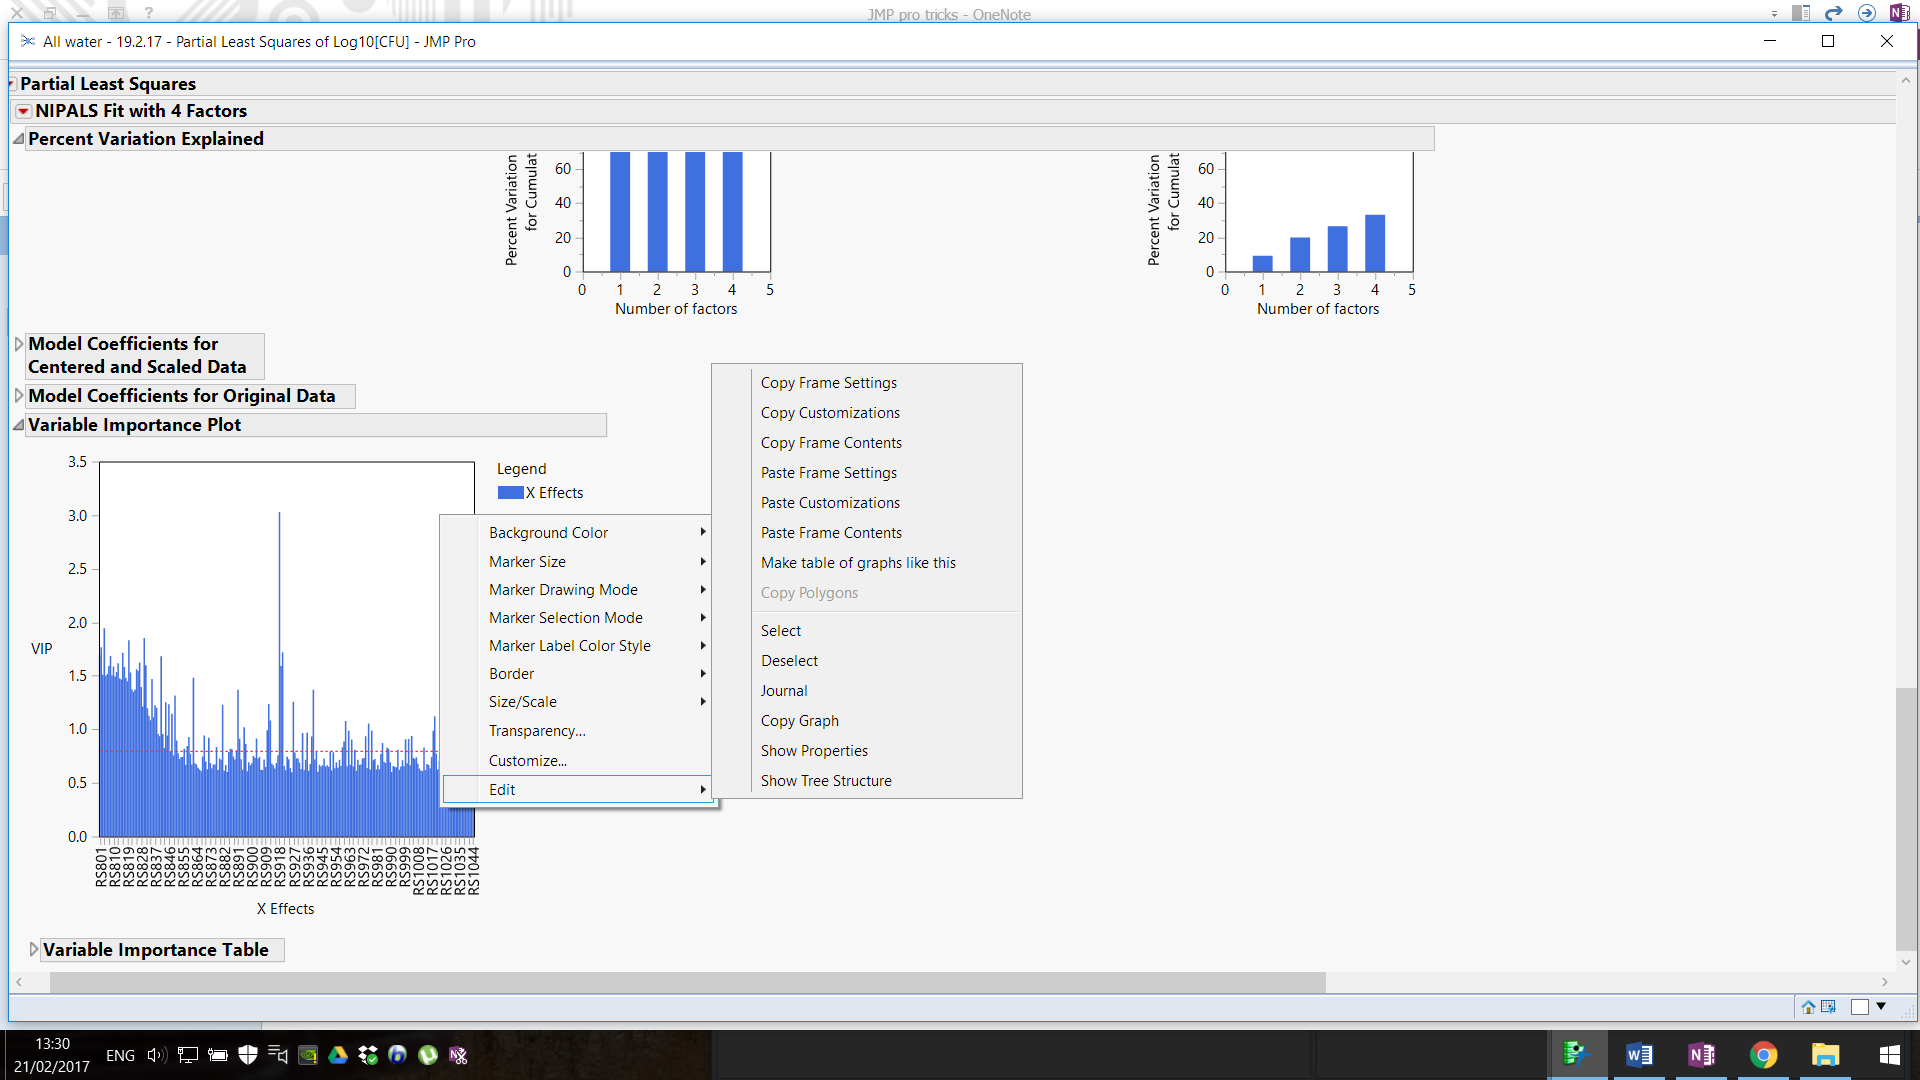
In my analysis I get a graph called the VIP (Variable importance plot). I need the list of points on this graph for further analysis ball all I can copy is a picture of the graph. any idea how to get the actual data? like x,y values.
If it helps I made a PLS (partial least squares) analysis.
Cheers,
Amir

Accepted Solutions

- Mark as New
- Bookmark
- Subscribe
- Mute
- Subscribe to RSS Feed
- Get Direct Link
- Report Inappropriate Content
Re: how can I get data table from a graph?
Amir,
Go to the Variable Importance Table below the graph. Right click anywhere in that table and select Make Into Data Table.
HTH.
Bill
- Mark as New
- Bookmark
- Subscribe
- Mute
- Subscribe to RSS Feed
- Get Direct Link
- Report Inappropriate Content
Re: how can I get data table from a graph?
Amir,
Go to the Variable Importance Table below the graph. Right click anywhere in that table and select Make Into Data Table.
HTH.
Bill
- Mark as New
- Bookmark
- Subscribe
- Mute
- Subscribe to RSS Feed
- Get Direct Link
- Report Inappropriate Content
Re: how can I get data table from a graph?
- Mark as New
- Bookmark
- Subscribe
- Mute
- Subscribe to RSS Feed
- Get Direct Link
- Report Inappropriate Content
Re: how can I get data table from a graph?
I am right there with you. Some days I can't even see the trees.

- Mark as New
- Bookmark
- Subscribe
- Mute
- Subscribe to RSS Feed
- Get Direct Link
- Report Inappropriate Content
Re: how can I get data table from a graph?
And to pile onto my colleague Bill Worley's recommendation, many, many JMP analysis platform report tabular report elements are supported by this 'right click in the table body' to create a JMP data table of the report element.

- Mark as New
- Bookmark
- Subscribe
- Mute
- Subscribe to RSS Feed
- Get Direct Link
- Report Inappropriate Content
Re: how can I get data table from a graph?
Dear All,
I have a big table of many experiments and I have created a bar plot, using graph builder, to compare one condition over diferent experiments. The graph builder already calculated the means and the STDEV. How can I export all the data which was used for this graph inludeing the calculated means and SDEV.
Regards
Ahmed
Recommended Articles
- © 2026 JMP Statistical Discovery LLC. All Rights Reserved.
- Terms of Use
- Privacy Statement
- Contact Us