This website uses Cookies. Click Accept to agree to our website's cookie use as described in our Privacy Policy. Click Preferences to customize your cookie settings.
- JMP User Community
- :
- Discussions
- :
- deployment model
Turn on suggestions
Auto-suggest helps you quickly narrow down your search results by suggesting possible matches as you type.
Topic Options
- Subscribe to RSS Feed
- Mark Topic as New
- Mark Topic as Read
- Float this Topic for Current User
- Bookmark
- Subscribe
- Printer Friendly Page

Level IV
- Mark as New
- Bookmark
- Subscribe
- Mute
- Subscribe to RSS Feed
- Get Direct Link
- Report Inappropriate Content
deployment model
Created:
Mar 30, 2021 11:55 AM
| Last Modified: Jun 8, 2023 08:31 PM
(2426 views)
Hi
to everybody.
In attached 2 jmp files. The one named Training-validation-test was used to build a RF model with the following results.
The file contains one numeric response and 20 different predictors with one of them categorical, The predictors are sensors values.

As you can see the Bias is very good while the variance is slightly high (92-69=23%).
Then a new database with examples never seen by the model was used to simulate the deployment of algorithm on new data.
With high surprise the result was really poor with a R2 between the predicted and the actual response close to zero. We were not able to understand this behavior. The R2=68% for test data after all doesn't seems to be really bad. So we were expecting to obtain for sure a R2 larger than zero.
Please any help/comment is welcome.
Felice-Gian
13 REPLIES 13

Level VII
- Mark as New
- Bookmark
- Subscribe
- Mute
- Subscribe to RSS Feed
- Get Direct Link
- Report Inappropriate Content
Re: deployment model
Virtually all of the X variables (with the exception of X12, X13, and X19) are significantly different, on average, between the two sets. So, my guess would be that the new data is not simply another random sample from the same population, but comes from a different population. It is not surprising that your model, which fit the original data fairly well, does so poorly on new data, when that new data comes from a different population.
I suppose the question to ask is why it comes from a different population? Apparently you thought the data was being drawn from the same population (or something close to that). But must of these variables look so different between the two sets that such an assumption is clearly not correct.
To see the differences, I concatenated the 2 tables and just used Fit Y by X, with Y being all of your X variables and X being the source table created when I concatenated them.

Level VII
- Mark as New
- Bookmark
- Subscribe
- Mute
- Subscribe to RSS Feed
- Get Direct Link
- Report Inappropriate Content
Re: deployment model
I agree to @dale_lehman , the new data is different.
I was able to fit a similar model, working also poorly on new data.

The Scatterplot matrix showing some details, e.g. X5 using very small range of the original data, same with X11 ...
In both pictures the new data is selected. Maybe this helps you to find the reason why there is a difference.

Georg
Level IV
- Mark as New
- Bookmark
- Subscribe
- Mute
- Subscribe to RSS Feed
- Get Direct Link
- Report Inappropriate Content
Re: deployment model
Hi Dale and Georg
thanks for your reply.
Really the differences between the two distributions for each predictors to me don't seems to be so different (see histograms in the attached picture. With bls we indicate the Training-Val-Test set and exp the set never seen by the model). Maybe the X20 shows a new peak in the never seen data that was absent before. But the remaining distributions are only less populated then previous ones.
If the predictor distribution of training set is wider than test one, the model should have "visited" the phase space occupied by the predictor of test set. Correct? So why it should do a bad prediction?
Anyway I confirmed (even though for us this is strange) what you say by taking randomly 2000 instances (instead of the last 2000 instances in thenever seen by the random forest model and once trained it was able to predict correctly the response. So if a slight difference in terms of average/std make a big difference in terms of prediction performance how we can use these models in production where the signals change continuously?
Rgds. Felice/Gian
Level VII
- Mark as New
- Bookmark
- Subscribe
- Mute
- Subscribe to RSS Feed
- Get Direct Link
- Report Inappropriate Content
Re: deployment model
Now that I look more closely, I see that this is time series data. From my initial views, it does not appear that the process has changed significantly. However, I think the problem is that the train-validate-test paradigm is not really appropriate for time series data. I'd suggest creating a distinct time period (e.g., the last month of the first data set) as the validation set and re-estimating the model. My guess will be that the model performance on the validation and never seen before data should be more similar if you estimate the model that way. I'm still a bit concerned about the noticeable differences between the X variables in the two data sets - it might require some more sophisticated time series modeling (such as modeling potential seasonality).
Level VII
- Mark as New
- Bookmark
- Subscribe
- Mute
- Subscribe to RSS Feed
- Get Direct Link
- Report Inappropriate Content
Re: deployment model
Meanwhile I believe that I will not be able to fit a valid/reasonable model for the data.
My first approach was to generate validation column statified by Xs.
The Timeseries hint from @dale_lehman was useful, so I looked also at the data in a timeseries manner,
realizing that with time the combination of the Xes change. And here it again looks to me like "New" is different. Yes, the Xes cover the same range, but that is not enough. I think, the combination is different in "New", that means, it is a kind of extrapolation. This would be not an issue for regression, but for methods like RF this counts (model is multidimensional and highly nonlinear, so difficult to look inside).
On the other side I was not able to fit a reasonable model with any other method (neural, Boosted Tree). It looks to me that we do not have the proper information in the X-columns to build a solid model.
So I would look into the physics of the process or whatever it is,
- how the Xes may/can change the Y,
- what the noise may be
- and what makes the things change over time, and include it into the dataset.
- and I'm also curious about the data structure, there are groups of rows with same date and same values for some parameters
What me surprised is that, when I made a validation column that is stratified by time, I got the same result (fair model for the first part, no model with the new data).
Good luck,
Georg
Level VII
- Mark as New
- Bookmark
- Subscribe
- Mute
- Subscribe to RSS Feed
- Get Direct Link
- Report Inappropriate Content
Re: deployment model
I have a couple of suggestions. First, I would try first differencing your response variable and then trying random forests again. For me, that is the easiest approach to time series data - and it is possible that the data will be better behaved when looked at that way. I would still manually create the validation set as the last time period rather than a random selection of rows. The second idea is something you noticed - there are time groupings, such as multiple observations closely linked in time. You might consider making the time sequence uniform by summarizing observations closely related in time. Time series are better behaved if the time variable is uniformly measured, so that means your data will need to be summarized into equal spaced time intervals. As you are suggesting, it is time to go back to thinking about exactly what is being measured and how it is being measured.
Level IV
- Mark as New
- Bookmark
- Subscribe
- Mute
- Subscribe to RSS Feed
- Get Direct Link
- Report Inappropriate Content
Re: deployment model
Hi George and Dale
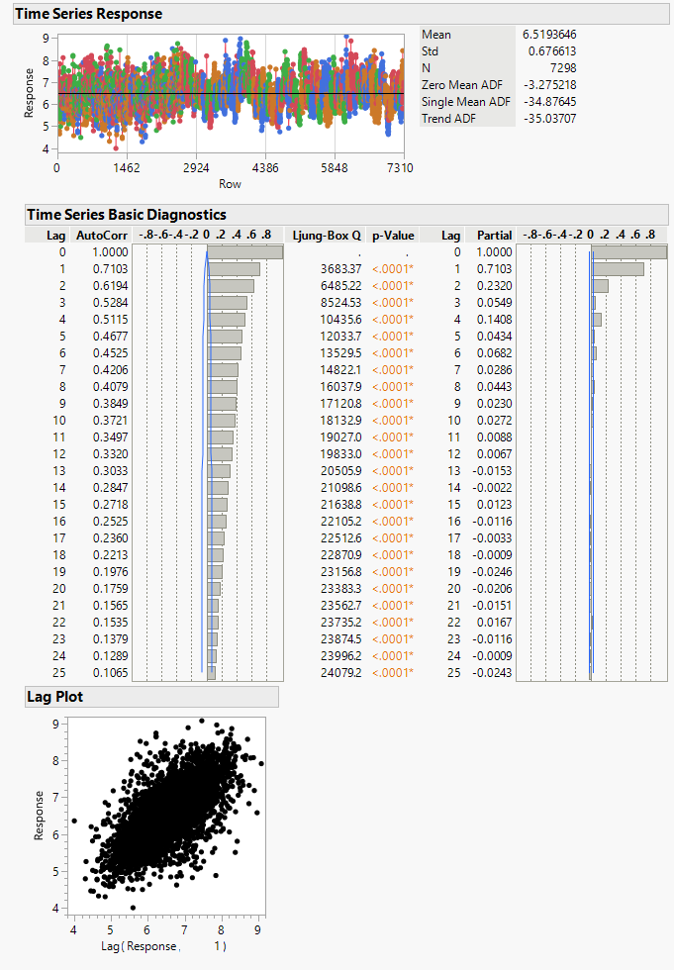
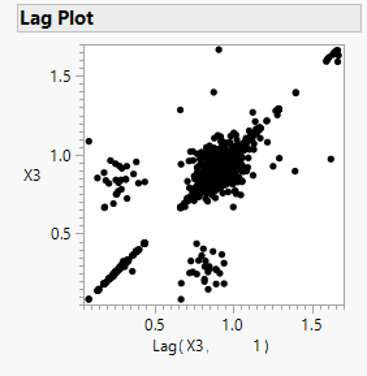
thank you very much for your answers. I give a look at the lag plot of all predictors and response and with my big surprise I discovered a very long autocorrelation (see attached pictures).
Since the data come from a semiconductor fab, the value 25 visible in the ACF is related to the number of the wafers in a lot.
The points out line instead in the lag plots are just the first wafers of a different lot loaded in the macgine. I think that the autocorrelation is due to internal feedback present in our machine to keep the working point. Of course those adjustments are hidden in to the chamber and not under our control and understanding. The response also show a clear lag that I cannot explain. But is there.
I tried to use the lag, moving average, smoothing and other predictors features engineering but the results continue to be really bad.
Next step I want to try the differencing that Dale proposed. Do you believe that the simple difference X(t)-X(t-1) can be enough?
Ciao Felice
Level VII
- Mark as New
- Bookmark
- Subscribe
- Mute
- Subscribe to RSS Feed
- Get Direct Link
- Report Inappropriate Content
Re: deployment model
The PACF plot suggests that the first two lags are the relevant ones - by far, the first lag is the most important. So, I think simple first order differencing would be a good thing to try. It may be possible that one of the machine learning models (e.g., RF, boosted trees, neural nets) will perform well, so I would try them. But you also should try some more standard time series models (where you would not use the differencing, as the time series models are built to account for the autocorrelation in various ways). In theory, if you use first order differencing (and if that largely eliminates the time structure), then you can probably use a random train-validate-test set for your modeling. At least, that's what I think - others may know better.
Level IV
- Mark as New
- Bookmark
- Subscribe
- Mute
- Subscribe to RSS Feed
- Get Direct Link
- Report Inappropriate Content
Re: deployment model
Hi Dale
since also the predictors show the same PACF, do you think that could be useful differencing the predictors too beside the response?
Thanks Felice
- © 2024 JMP Statistical Discovery LLC. All Rights Reserved.
- Terms of Use
- Privacy Statement
- About JMP
- JMP Software
- JMP User Community
- Contact