- JMP will suspend normal business operations for our Winter Holiday beginning on Wednesday, Dec. 24, 2025, at 5:00 p.m. ET (2:00 p.m. ET for JMP Accounts Receivable).
Regular business hours will resume at 9:00 a.m. EST on Friday, Jan. 2, 2026. - We’re retiring the File Exchange at the end of this year. The JMP Marketplace is now your destination for add-ins and extensions.
- Subscribe to RSS Feed
- Mark Topic as New
- Mark Topic as Read
- Float this Topic for Current User
- Bookmark
- Subscribe
- Mute
- Printer Friendly Page
Discussions
Solve problems, and share tips and tricks with other JMP users.- JMP User Community
- :
- Discussions
- :
- correct interpretation of leverage plot

- Mark as New
- Bookmark
- Subscribe
- Mute
- Subscribe to RSS Feed
- Get Direct Link
- Report Inappropriate Content
correct interpretation of leverage plot
I am looking at fit least square results and there are two factors in the model (after reducing the model two factors are left). The whole model is not significant but the leverage plot for factor 'A' is significant. I wanted to check if this is the correct interpretation of the leverage plot: 'Although whole model is not significant but leverage plot shows that factor 'A' has an impact on the response'. ?
Accepted Solutions

- Mark as New
- Bookmark
- Subscribe
- Mute
- Subscribe to RSS Feed
- Get Direct Link
- Report Inappropriate Content
Re: correct interpretation of leverage plot
Thanks for sharing. There are a number of ways to proceed.
- You might accept the determination from the whole model test that none of the terms are significant. This approach is conservative. The risk is that you make a type II error.
- You might relax the common standard of alpha = 0.05 for significance if this case is a screening study. That is, accept a higher chance of a type I error in order to reduce the chance of a type II error, which is more concerning when screening. This approach assumes that you will verify the conclusion with future observations. For example, make predictions of the response at new factor levels and empirically confirm them.
- You might collect more observations, especially at the ends of the factor ranges, in order to see if the trends hold when repeating the regression analysis. You might consider extending the ranges at this stage to produce a larger effect, if that change is physically feasible. This approach is prudent and economical because such observations would have maximum leverage.
- Mark as New
- Bookmark
- Subscribe
- Mute
- Subscribe to RSS Feed
- Get Direct Link
- Report Inappropriate Content
Re: correct interpretation of leverage plot
A regression analysis often involves many hypothesis tests. It is possible, therefore, that you might get a false significance, a type I error. In this case, it is also possible that you have a high leverage observation for one of the factors. Can you show us a picture of the Actual by Predicted and the Leverage Plots?
- Mark as New
- Bookmark
- Subscribe
- Mute
- Subscribe to RSS Feed
- Get Direct Link
- Report Inappropriate Content
Re: correct interpretation of leverage plot
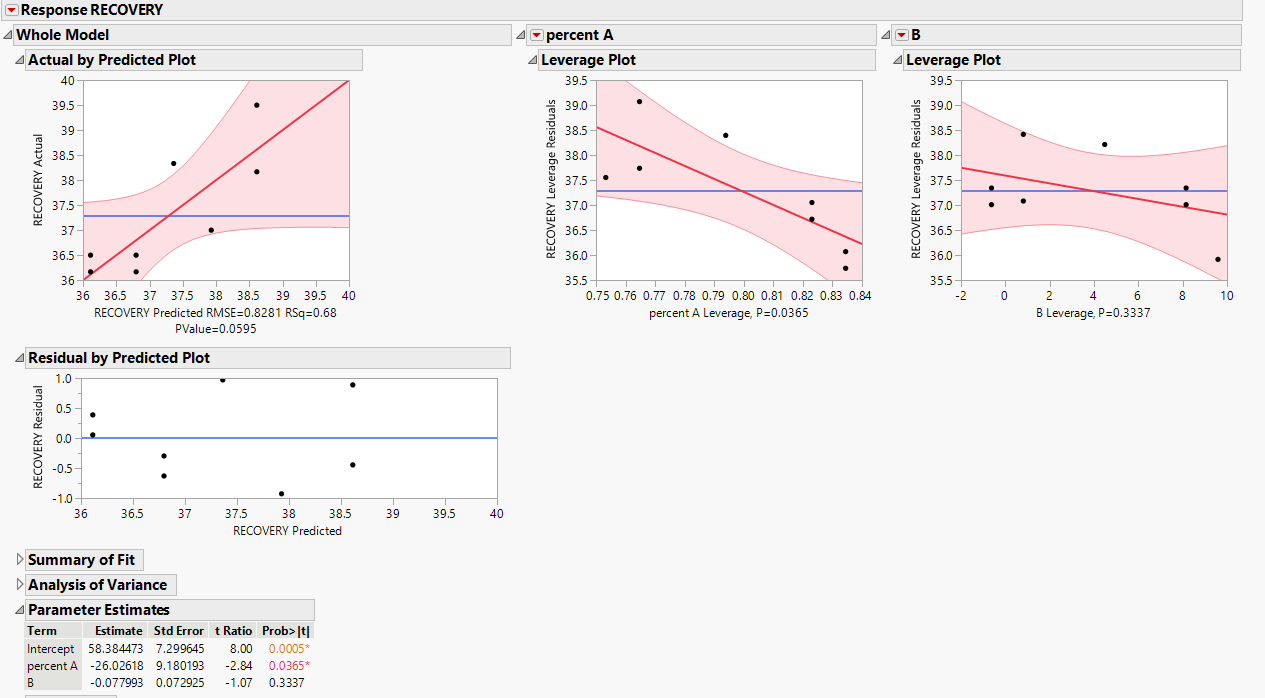
@Mark_Bailey these are the plots.
- Mark as New
- Bookmark
- Subscribe
- Mute
- Subscribe to RSS Feed
- Get Direct Link
- Report Inappropriate Content
Re: correct interpretation of leverage plot
Thanks for sharing. There are a number of ways to proceed.
- You might accept the determination from the whole model test that none of the terms are significant. This approach is conservative. The risk is that you make a type II error.
- You might relax the common standard of alpha = 0.05 for significance if this case is a screening study. That is, accept a higher chance of a type I error in order to reduce the chance of a type II error, which is more concerning when screening. This approach assumes that you will verify the conclusion with future observations. For example, make predictions of the response at new factor levels and empirically confirm them.
- You might collect more observations, especially at the ends of the factor ranges, in order to see if the trends hold when repeating the regression analysis. You might consider extending the ranges at this stage to produce a larger effect, if that change is physically feasible. This approach is prudent and economical because such observations would have maximum leverage.
- Mark as New
- Bookmark
- Subscribe
- Mute
- Subscribe to RSS Feed
- Get Direct Link
- Report Inappropriate Content
Re: correct interpretation of leverage plot
@Mark_Bailey Thank you for your response. One follow-up question: Do you think FDR p-value helps in this case to filter out the coincidence (that factor A is significant)? Because of this result (that I showed you before), the effect summary shows that factor 'A' is significant (shown below).

And if I check the FDR effect summary shows following results.

- Mark as New
- Bookmark
- Subscribe
- Mute
- Subscribe to RSS Feed
- Get Direct Link
- Report Inappropriate Content
Re: correct interpretation of leverage plot
NO!
FDR is intended for situations with very many terms in the model. It is aimed at controlling the inflation of the type I error rate experiment-wise.

- Mark as New
- Bookmark
- Subscribe
- Mute
- Subscribe to RSS Feed
- Get Direct Link
- Report Inappropriate Content
Re: correct interpretation of leverage plot
I'm confused by your initial post. Looking at the leverage plots, none of the factors or the whole model look significant. My understanding is that the confidence curve must cross the horizontal line. Also it looks like you might have 1 or 2 residuals that look unusual. I'm not sure how you selected these factors from your screening experiment, but you might want to revisit this. And, of course, Mark has some good advice.
- Mark as New
- Bookmark
- Subscribe
- Mute
- Subscribe to RSS Feed
- Get Direct Link
- Report Inappropriate Content
Re: correct interpretation of leverage plot
@statman @Mark_Bailey So the part I am confused about is no factor is significant but still in the effect summary factor 'percent A' is significant.
- Mark as New
- Bookmark
- Subscribe
- Mute
- Subscribe to RSS Feed
- Get Direct Link
- Report Inappropriate Content
Re: correct interpretation of leverage plot
I am not sure what you mean or why you say, "So the part I am confused about is no factor is significant but still in the effect summary factor 'percent A' is significant." I am guessing that you mean to ask is how can the ANOVA return a p-value above 0.05 when the p-value for one of the factors is less than 0.05.
The ANOVA uses the F ratio to compare the mean sum of squares of the model to the mean sum of squares of the errors. It is an omnibus test of any non-zero parameter. The parameter estimates use the t ratio to compare the estimate to the hypothesized value (zero) to the standard error of the estimate. The ANOVA and t tests are not directly connected in any way. These two tests are based on different hypotheses and methods. It is true that if one factor has a p-value that is much less than 0.05 then it is more likely that the ANOVA will have a p-value less than 0.05, but it is not directly proportional. In your case, the p-values for the ANOVA and the factor are both close to the arbitrary 0.05 significance level. Neither enjoys particularly strong evidence to reject the null hypothesis (zero).
Let me know if either I did not interpret your last question correctly or if I did not clarify the issue.
- Mark as New
- Bookmark
- Subscribe
- Mute
- Subscribe to RSS Feed
- Get Direct Link
- Report Inappropriate Content
Re: correct interpretation of leverage plot
Regarding the decision of significance by the leverage plots, the horizontal reference line (no effect) is not contained within the confidence region for percent A if you extend the plot beyond the original scale. The visual assessment in the plot must agree with the numerical assessment of the p-value to the default significance level of 0.05.
Recommended Articles
- © 2025 JMP Statistical Discovery LLC. All Rights Reserved.
- Terms of Use
- Privacy Statement
- Contact Us