- Subscribe to RSS Feed
- Mark Topic as New
- Mark Topic as Read
- Float this Topic for Current User
- Bookmark
- Subscribe
- Mute
- Printer Friendly Page
Discussions
Solve problems, and share tips and tricks with other JMP users.- JMP User Community
- :
- Discussions
- :
- Re: X axis not linear with Variability Chart or Oneway graph

- Mark as New
- Bookmark
- Subscribe
- Mute
- Subscribe to RSS Feed
- Get Direct Link
- Report Inappropriate Content
X axis not linear with Variability Chart or Oneway graph
Hello,
When using Variability Chart it is not possible to allow linear representation of X axis.
When using Oneway, with Display options --> X axis Proportional, nothing happens, my X axis always with same intervals not linear with X axis values.
If I use Graph builder automatically the X axis is shown in linear mode.
Can you help to solve this issue, in effect I do not see with Variability chart the possibility to change X axis as for Bivariate or other for example, in which we can choice linear/log etc.
Thanks a lot for your help,
Vincenzo

- Mark as New
- Bookmark
- Subscribe
- Mute
- Subscribe to RSS Feed
- Get Direct Link
- Report Inappropriate Content
Re: X axis not linear with Variability Chart or Oneway graph
Without seeing what your data table looks like it is a bit difficult to address your question but I would look into the properties of the column you use as X variable to see if there are any special settings for the Axis category. Also, based on your description of the Fit Y by X platform, it looks like the column you use for X variable is ordinal or categorical. Hence, have you considered to switch to a numerical and continuous format (if it makes sense).
Best,
TS
- Mark as New
- Bookmark
- Subscribe
- Mute
- Subscribe to RSS Feed
- Get Direct Link
- Report Inappropriate Content
Re: X axis not linear with Variability Chart or Oneway graph
Hi,
thanks a lot for your feedback.
I am using a numerical continuous parameter (to represent in Y axis) depending of temperature for example (that is defined as numerical continuous variable).
When I use variability chart the problem is that I see in X axis (Temperature) the same intervals (same larger) between -40 / 30°C & 30 / 150 without the possibility to allow linear representation of X axis.
Thanks,
Vinc
- Mark as New
- Bookmark
- Subscribe
- Mute
- Subscribe to RSS Feed
- Get Direct Link
- Report Inappropriate Content
Re: X axis not linear with Variability Chart or Oneway graph
Based on your original post, the Fit Y by X platform only lists the option of "Proportional X Axis" when the X-axis data is either ordinal or categorical. Hence, there might be some confusion about the actual properties of the column you use as X axis. Your values might be continuous but the column properties might be set up otherwise (e.g. if you have characters in the data)?
When you go to Column Info menu (right-click on the column header), what is the Data Type and Modeling Type? Also under column properties, are there any entries such as Value Labels, Axis, or something else?
Could you share the data table you are working on? If not, could you post an image of the Column Info panel for your X-Axis data column?
Best,
TS
- Mark as New
- Bookmark
- Subscribe
- Mute
- Subscribe to RSS Feed
- Get Direct Link
- Report Inappropriate Content
Re: X axis not linear with Variability Chart or Oneway graph
Hello,
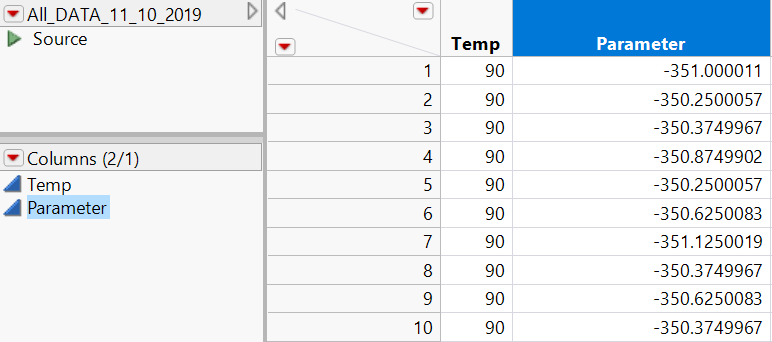
Hoping the attached file can help to understand.
I use "Temp" column for X axis (column is defined as Numeric Continuous) and Parameter as data (Parameter is defined as Numeric Continuous also).
I use "Variability Chart" Graph (Parameter in Y, and Temp in X).
My problem is that in the graph the Temp values have the same distance one from the other, the X axis is not linear.
What I should like is to have the X axis linear.
Thanks for help,
Vinc
- Mark as New
- Bookmark
- Subscribe
- Mute
- Subscribe to RSS Feed
- Get Direct Link
- Report Inappropriate Content
Re: X axis not linear with Variability Chart or Oneway graph
I now understand what your problem is and I realized I don't know a work around to solve your issue. The Variability chart use a categorical structure for the X axis independent of the actual format of your data.
Sorry for not providing a better answer.
Best,
TS
- Mark as New
- Bookmark
- Subscribe
- Mute
- Subscribe to RSS Feed
- Get Direct Link
- Report Inappropriate Content
Re: X axis not linear with Variability Chart or Oneway graph
Hi Thierry,
ok no problem thanks a lot to have tried.
It is not a real issue just cosmetic for report graphs.
Anyway it is strange that JMP has not forecasted to manage X axis proportional or linear in Variability Chart as you can do for Y axis.
Hoping some JMP support people can take into account this possibility for next versions :)
Thanks again,
Vinc
- Mark as New
- Bookmark
- Subscribe
- Mute
- Subscribe to RSS Feed
- Get Direct Link
- Report Inappropriate Content
Re: X axis not linear with Variability Chart or Oneway graph
Just a final note: have you tried the "Control Chart Builder" which provides customization options akin to that available in Graph Builder?
Best,
TS
- Mark as New
- Bookmark
- Subscribe
- Mute
- Subscribe to RSS Feed
- Get Direct Link
- Report Inappropriate Content
Re: X axis not linear with Variability Chart or Oneway graph
Hello,
yes you are right, thanks a lot.
Graph Builder is ok with X axis linear.
Thanks again for your help,
Vinc

- Mark as New
- Bookmark
- Subscribe
- Mute
- Subscribe to RSS Feed
- Get Direct Link
- Report Inappropriate Content
Re: X axis not linear with Variability Chart or Oneway graph
Just as a control chart shows variation across time in a process, a variability chart shows the same type of variation across categories such as parts, operators, repetitions, and instruments. @Thierry_S is right that you should take a look at Control Chart Builder rather than variability chart. Variability chart is for categories and therefore uses a categorical axis.
Recommended Articles
- © 2026 JMP Statistical Discovery LLC. All Rights Reserved.
- Terms of Use
- Privacy Statement
- Contact Us