- New to JMP? Join us Sept. 23-24 for the Early User Edition of Discovery Summit, tailor-made for new users. Register now for free!
- Your voice matters! Tell us how you prefer to receive JMP updates, so we can tailor our communication to your needs. Take short survey.
- See how to access JMP Marketplace - and - find, create & share add-ins to extend your JMP. Watch video.
- Subscribe to RSS Feed
- Mark Topic as New
- Mark Topic as Read
- Float this Topic for Current User
- Bookmark
- Subscribe
- Mute
- Printer Friendly Page
Discussions
Solve problems, and share tips and tricks with other JMP users.- JMP User Community
- :
- Discussions
- :
- Re: High RMSE in DSD analysis

- Mark as New
- Bookmark
- Subscribe
- Mute
- Subscribe to RSS Feed
- Get Direct Link
- Report Inappropriate Content
Why is the RMSE so high in this DSD analysis
Hi,
I am new to DOE and Definitive Screening Design, that is why I am having some questions regarding the analysis of DSD. I am using JMP 13.
I want to find significant factors in the process of spherical crystallization. I did Definitive Screening Design with 6 factors on three levels, with four additional runs (2 fake factors). I am measuring several different responses. The design evaluation shows me, that I have good statistical power. However, when I try to analyse the results using Fit Definitive Screening, I get none or one at best significant main effects. As a consequence, I also get none significant second order effects (see the added photo below, right). I think the reason for that is very high RMSE. I was learning how to do Fit Defintive Screening on the example shown in the JMP tutorial (file Extraction 3, see added photo below, left). When I analysed the example I got the same results as shown in the tutorial. I also noticed, that in analysing extraction 3 RMSE was much lower, although responses in Extraction 3 and in my experiment were approximately the same size, since both of responses are Yield.
I don't understand how is it possible that the difference in the RMSE is so big. If you look at the distributon in main effect plot, you can see, that the distribution in my experiment is similar, if not a bit narrower that the distribution in Extraction 3. I also calculated RMSE using Fit Y by X tool, where I got bigger RMSE in Extraction 3 (around 20) than in my experiment (around 18). That's why it looks like the analysis with Fit Definitive Screening makes the difference.
Am I missing something?
Should I do some preanalysis processes with my data prior to Fit Definitive Screening?
Or do I really have an experiment with big RMSE. If so, is it possible to fix that?
Thank you.
Danijel
%20and%20my%20experiment%20(right).png)
Accepted Solutions

- Mark as New
- Bookmark
- Subscribe
- Mute
- Subscribe to RSS Feed
- Get Direct Link
- Report Inappropriate Content
Re: High RMSE in DSD analysis
Thank you for a careful explanation of your situation and your question. We will try to help you based on your explanation.
Yes, the biggest difference between the tutorial example and your experiment is the RMSE. This difference means lower power. It means that the t ratios for testing the parameter estimates against zero will be smaller by a factor of 9.6 for equivalent estimates, and accordingly have much higher p-values. (This decrease in t ratio or increase in p-value is equivalent to lower power.)
What values did you enter for statistical significance (0.05), RMSE (1), and anticipated coefficients (1) to determine the power? That is to ask, for what outcome is the power good? What is the power that you obtained for your design?
The RMSE is an estimate of the standard deviation of the response. It is model-dependent. It assumes that
- the linear regression model is correct (unbiased)
- it includes only the random error of the response
- the variance of the response is constant over the entire range of the response.
If your model does not include terms for active (non-random) effects, then this contribution to the response will be pooled with the estimate of RMSE and inflate it.
Please keep in mind that the mean and the standard deviation of responses that are normally distributed are generally independent attributes of the response. That is, the standard deviation (RMSE) does not depend on the mean. The parameter estimates are for the model of the mean response, so you cannot expect anything of the RMSE based on the magnitude of the parameter estimates.
Let's review the key principles of screening:
- Sparsity of Effects: there are many potential factors (and their effects) but, in fact, most are inactive (parameter is zero).
- Hierarchy of Effects: most of the change in the response is first order, the second most effect is second order, and so on.
- Heredity of Effects: any higher order effects are exhibited by the same factors that exhibit lower order effects.
- Projection of Design: the design limits the estimation of all the potential parameters by correlation but the correlation is reduced or eliminated as the inactive factors and their inactive effects are removed from the model.
How many of the six factors do you expect to be active? It should not be more than two or possibly three, or else any screening design will fail.
Screening designs are primarily intended to support first order models. (Screening is not about optimizing factors but only about screening for the vital few factors. The DSD is special because it reduces the likelihood that you might have to augment to support the more complex model needed for optimization.) A responses of a chemical process such as crystallization are likely to exhibit second order effects such as interactions and non-linearity. These effects can bias the estimates of the parameters in the first order model, although a DSD, a type of alias-optimal design, minimize such correlation.
A couple of closing thoughts:
- Does this study include mixture components? I wonder about the solvents used together. That condition might necessitate a different design (custom design).
- Was this experiment fully randomized? That means that you reset every factor before every run. Another way to ask is, do you have hard to change factors? That condition would necessitate a different design (split-plot design). If you have hard to change factors and do not fully randomize the experiment, then you will affect the RMSE. In turn, it will also increase the type I error rate of tests for the hard to change factors and increase the type II error rate of tests for the easy to change factors. That could explain the lack of significant effects.
- What about other factors besides the six that were varied in the experiment? Did you identify all the factors of each response before selecting the six factors for study? How were these outside factors controlled during the runs? Uncontrolled and unaccounted for effects would either contribute to the random variation or, if they were correlated with the factor levels in the study, or contribute bias to the estimates.
- Did you perform any residual analysis? Is there an indication of any data problems or violations of the assumptions of the linear regression model? Residual analysis is more difficult with economical designs than it is with larger data sets but still valuable. It appears that the run with the highest yield might be an outlier. This run could exhibit unusually high influence on the estimates. It could increase the RMSE.
That is all that I can think of at the moment. Hopefully other experts will reply with more ideas.
- Mark as New
- Bookmark
- Subscribe
- Mute
- Subscribe to RSS Feed
- Get Direct Link
- Report Inappropriate Content
Re: High RMSE in DSD analysis
Thank you for your comprehensive answer and explanations. They have been very helpful to me. I will try to clarify any uncertanties and answer the questions you were asking. In order to avoid confusion, I will mark the answers numerically.
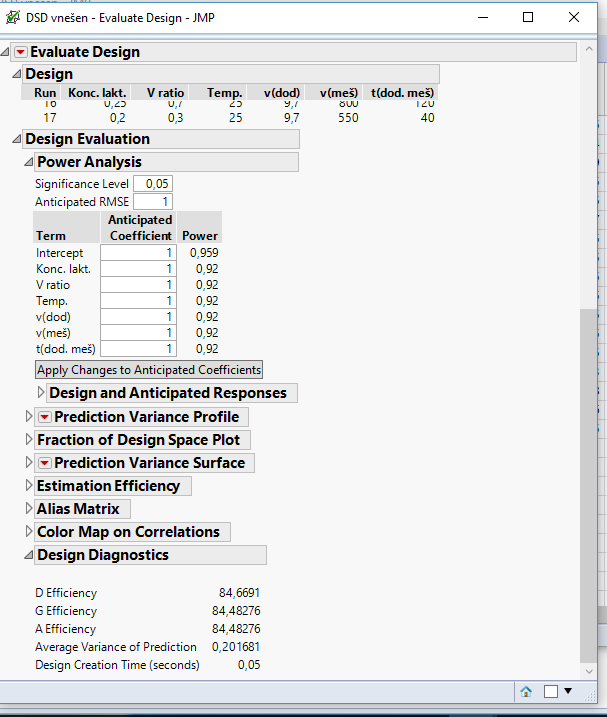
1. In section Evaluate Design I entered 0,05 for statistical significance, 1 for anticipated coefficients and 1 for RMSE. I entered these values prior to experiments, since I got no information about what RMSE or anticipated coefficients can I expect. I obtained the power 0,92 (see the photo Evaluate design below). I am aware that such power would be the case only if RMSE would really be around 1, I just wanted to demonstrate that the design looked good prior to experiments. Of course, if I put in the values I got for RMSE and anticipated coefficients, the power is much lower(see photo Evaluate design 2 below).
2. I don't know for certain, but I expect around four main effects to be active. However Mr. Jones and Mr. Nachtsheim stated in an article from 2016 (Bradley Jones & Christopher J. Nachtsheim (2016): Effective
Design-Based Model Selection for Definitive Screening Designs, Technometrics), that in the analysis of DSD with 6 factors and 4 additional runs (using the new approach for DSD analysis) all 6 main factors could be detected with the power of 0,99. If I look at that number, I don't see the problem in many active main effects. Or am I missing something?
3. Yes, this experiment contains mixture components. One of the factors is non-solvent volume to the final volume ratio (in final volume we have non-solvent and water). With the peristaltic pump I added the solution in the non-solvent. Do you think that it would be better to leave that ratio constant? I am thinking that this could be the reason for the big RMSE. However, I cannot afford to make many more experiments, so I need to soften this problem (if that is the case), if it is possible.
4. Yes, this experiment was fully randomised. I don't have hard to change factors, I also had relatively good control of factors during the experiment.
5. I am aware that there are also other factors that could affect the response. However, I tried to control every factor that I could, so I don't see a big problem in my experiment here.
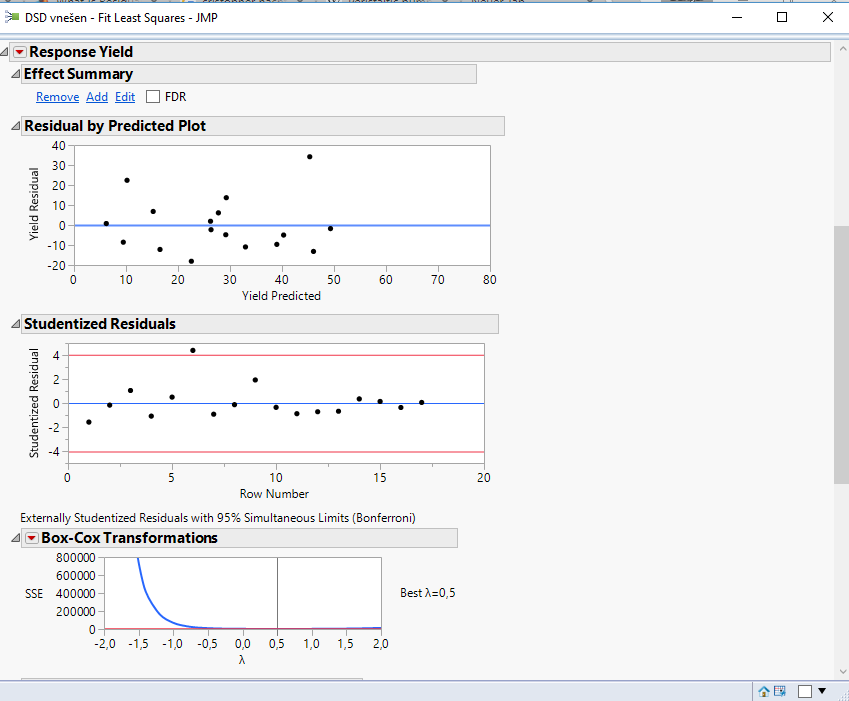
6. You are correct, that the run with the highest yield is the outlier. That is also very clear from the Studentised Residuals (see photo Residuals below). However, when I look at the residual analysis of the other responses the outlier is not present, but the RMSE is still big. So I think, that there needs to be an additional reason for the big RMSE.
7. I also have a new question. As I was playing with the analysis with the Fit Definitive Screening, I noticed, that RMSE is lower if I include fake factors in the analysis. (see the photo Analysis with fake factors below. On the left side, there are estimates that I got and on the right side there is selection of response and factors). Am I allowed to do this?
Thank you.
Danijel
.png)
- Mark as New
- Bookmark
- Subscribe
- Mute
- Subscribe to RSS Feed
- Get Direct Link
- Report Inappropriate Content
Re: High RMSE in DSD analysis
I just lost my reply when I clicked Post and I must leave now on a trip but I will try to quickly re-capture my reply.
- You understand that the power is a function of the significance, variance, effect size, and sample size. Using the default values for RMSE and coefficients is unlikely to provide a power analysis for a specific situation.
- Your DSD should be able to find up to six main effects with high power if their effect size is large and there are few second order effects. My earlier comment was a generality. It might not be a much value as it depends on so many attributes.
- You could also include the two non-aqueous solvents and water as three mixture factors (components) and model them directly. I have no idea if the use of the peristaltic pump is the cause of the large RMSE.
- Fully randomized runs - check!
- No problem with uncontrolled, external factors - check!
- The large RMSE remains unexplained - check!
- Generally speaking, adding additional terms to the linear regression model reduces the RMSE even if these terms are not significant. The sum of squares attributed to each new term would otherwise go to the error sum of squares.
- Mark as New
- Bookmark
- Subscribe
- Mute
- Subscribe to RSS Feed
- Get Direct Link
- Report Inappropriate Content
Re: High RMSE in DSD analysis
Thank you for your answer and your effort.
I have only one reply, since other points are quite clear to me now.
7. Yes, that makes sense, mathematically speaking. I just don't know if I am allowed to do this in Fit Definitive Screening (so, the results I get are still correct and trustworthy). I find it odd, that the result is different, then when I don't include fake factors in my selection, since Fit Definitive Screening computes the initial RMSE from fake factors either way.
Do you maybe have any explanation for that?
- Mark as New
- Bookmark
- Subscribe
- Mute
- Subscribe to RSS Feed
- Get Direct Link
- Report Inappropriate Content
Re: High RMSE in DSD analysis
Obviously, if you were able to add fake factors to your analysis then you are 'allowed.' The "results (you) get are still correct and trustworthy" but what do they mean? What does the fake-factor-turned-real-factor represent? Did you use this design column to set factor levels? (No.) What are these factor levels? Why would you include it in the analysis?
You can add any column to the model matrix and estimate the linear parameter for it as long as this column is not confounded with the column used to estimate another term in the model. If they are confounded, then these two columns are just aliases for the same column. That combination produces a singularity in the projection matrix for the regression. Such a combination is disallowed. JMP attempts to estimate as many parameters that are not confounded (up to the rank of the model matrix) and zeros the rest.
The reason that the result is different is because If you explicitly include a fake factor in the model, then it is no longer a fake factor in the analysis and it is no longer used to estimate the RMSE as before.
- Mark as New
- Bookmark
- Subscribe
- Mute
- Subscribe to RSS Feed
- Get Direct Link
- Report Inappropriate Content
Re: High RMSE in DSD analysis
Yes, you stated some very good questions, which basically answer my question. I understand what you mean.
So it looks like, that my model was not constructed as good as it could be, hence big RMSE. I can still detect main factors with the highest influence on the model, but unfortunately I can't detect any second factor interaction. Of course, one option is, that they aren't present, but the other, more probable is, that they are too small to detect with so high RMSE.
Thank you again for your help.
Danijel
- Mark as New
- Bookmark
- Subscribe
- Mute
- Subscribe to RSS Feed
- Get Direct Link
- Report Inappropriate Content
Re: High RMSE in DSD analysis
Your model is as good as it can be given this sample of data and the objective process of model selection (Fit Definitive Screening).
You might try re-running a few of these conditions to see if the RMSE is really that high. Perhaps instead you have some historical data for the same process that could be re-analyzed to determine the RMSE. It might really be high and not necessarily an artifact of the biased model.
Another option, giving up the Fit Definitive Screening analysis, is Analyze > Fit Model > Loglinear Variance. This analysis iteratively fits two converging models: one for the mean and the other for the variance. You might use this analysis to see if one of the design factors is responsible. Unfortunately, the economy of the DSD may preclude a good analysis, but it is worth trying.
See Help > Books > Fitting Linear Models. There is a chapter devoted to this analysis.
- Mark as New
- Bookmark
- Subscribe
- Mute
- Subscribe to RSS Feed
- Get Direct Link
- Report Inappropriate Content
Re: High RMSE in DSD analysis
I also want to remind you that you can use custom design to augment your initial experiment if it is possible to perform more runs. You mentioned earlier that you don't have resources to do more but I just want to mention it anyway in case it becomes possible later. The new runs are added to the DSD you already have.

- Mark as New
- Bookmark
- Subscribe
- Mute
- Subscribe to RSS Feed
- Get Direct Link
- Report Inappropriate Content
Re: High RMSE in DSD analysis
One final comment that is a different approach. Since you have a high RMSE, you may wish to conduct a measurement system study. Perhaps the high RMSE is because of a measurement system that might need to be improved first. It may be something to consider before adding more experimental runs.
Recommended Articles
- © 2026 JMP Statistical Discovery LLC. All Rights Reserved.
- Terms of Use
- Privacy Statement
- Contact Us