- Instantly extract effect sizes, F-ratios, and FDR-adjusted p-values from your models with the Calculate Effects Sizes extension, available now in the JMP Marketplace!
- New to JMP? Join us Sept. 23-24 for the Early User Edition of Discovery Summit, tailor-made for new users. Register now for free!
- Your voice matters! Tell us how you prefer to receive JMP updates, so we can tailor our communication to your needs. Take short survey.
- Subscribe to RSS Feed
- Mark Topic as New
- Mark Topic as Read
- Float this Topic for Current User
- Bookmark
- Subscribe
- Mute
- Printer Friendly Page
Discussions
Solve problems, and share tips and tricks with other JMP users.- JMP User Community
- :
- Discussions
- :
- What does it mean if both my predicted plot P value and my Prob > F are both sig...

- Mark as New
- Bookmark
- Subscribe
- Mute
- Subscribe to RSS Feed
- Get Direct Link
- Report Inappropriate Content
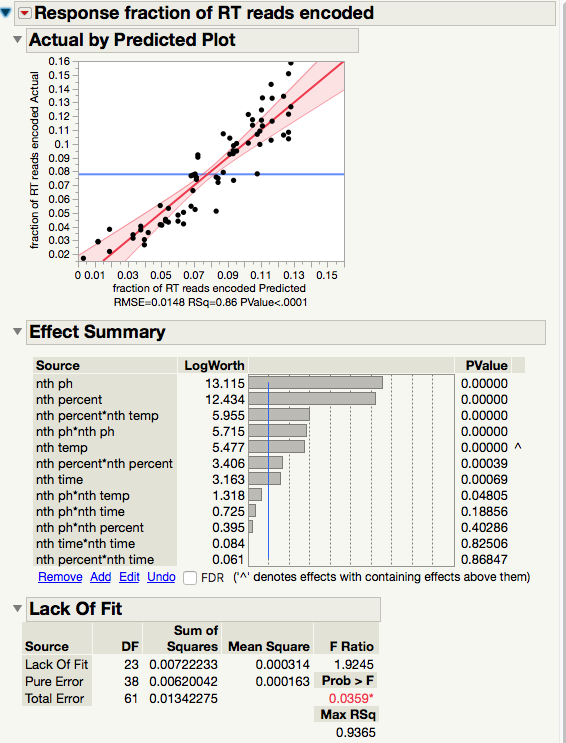
What does it mean if both my predicted plot P value and my Prob > F are both signficant?
Hi,
I'm running datasets where I'm getting really nice RMSE (0.86-0.90) and P value < 0.0001 for my predicted plots, but my Prob > F is still signficant for Lack of Fit. What does this mean? Example pasted below.

Accepted Solutions

- Mark as New
- Bookmark
- Subscribe
- Mute
- Subscribe to RSS Feed
- Get Direct Link
- Report Inappropriate Content
Re: What does it mean if both my predicted plot P value and my Prob > F are both signficant?
A model can be significant and explain a lot of variability and still exhibit lack of fit. For example, the model may be missing an important term, as shown in the attached simple example.

A significant lack of fit usually indicates that the model form is not correct and usually indicates that there is a curvilinear relationship. Residual plots are the best and easiest tool to use to try and determine why there is a lack of fit. A good residual plot will show random scatter. Any pattern will indicate a systematic problem with your chosen model. For my simple example, here is a residual plot (there is more than one residual plot, so look at all of them to help determine the problem with your model).

There is an obvious pattern here indicating that I need a quadratic term in the model to estimate the curvature. I THINK this is a problem with your model as well, but the residual plots should help you.
- Mark as New
- Bookmark
- Subscribe
- Mute
- Subscribe to RSS Feed
- Get Direct Link
- Report Inappropriate Content
Re: What does it mean if both my predicted plot P value and my Prob > F are both signficant?
- Mark as New
- Bookmark
- Subscribe
- Mute
- Subscribe to RSS Feed
- Get Direct Link
- Report Inappropriate Content
Re: What does it mean if both my predicted plot P value and my Prob > F are both signficant?
A model can be significant and explain a lot of variability and still exhibit lack of fit. For example, the model may be missing an important term, as shown in the attached simple example.
A significant lack of fit usually indicates that the model form is not correct and usually indicates that there is a curvilinear relationship. Residual plots are the best and easiest tool to use to try and determine why there is a lack of fit. A good residual plot will show random scatter. Any pattern will indicate a systematic problem with your chosen model. For my simple example, here is a residual plot (there is more than one residual plot, so look at all of them to help determine the problem with your model).
There is an obvious pattern here indicating that I need a quadratic term in the model to estimate the curvature. I THINK this is a problem with your model as well, but the residual plots should help you.
Recommended Articles
- © 2026 JMP Statistical Discovery LLC. All Rights Reserved.
- Terms of Use
- Privacy Statement
- Contact Us