- Don’t miss your chance to experience Discovery Summit Europe at our best available rate! Early bird registration through 31 Oct.
- Graph Builder Toolbar streamlines interactive graphing. Creates shortcuts on Report and GraphBuilder Helpers toolbars. Download and install the extension.
- Subscribe to RSS Feed
- Mark Topic as New
- Mark Topic as Read
- Float this Topic for Current User
- Bookmark
- Subscribe
- Mute
- Printer Friendly Page
Discussions
Solve problems, and share tips and tricks with other JMP users.- User Community
- :
- Discussions
- :
- Re: What do the red and yellow numbers mean in the fixed effect tests

- Mark as New
- Bookmark
- Subscribe
- Mute
- Subscribe to RSS Feed
- Get Direct Link
- Report Inappropriate Content
What do the red and yellow numbers mean in the fixed effect tests
I ran the fit group analysis.
I am looking at the fixed effect test report and I wanted to know if the yellow prob > F values show a positive correlation meaning the higher the value the more positive the effect and the red prob >F values indicate a negative correlation meaning the lower the value the better the result.
Accepted Solutions


 Community Manager
- Mark as New
- Bookmark
- Subscribe
- Mute
- Subscribe to RSS Feed
- Get Direct Link
- Report Inappropriate Content
Re: What do the red and yellow numbers mean in the fixed effect tests
Hi mpatpc,
The coloring on p-values, conditional formatting as it's called in JMP, is based on how small the p-value is. By default, P-values are colored red if they are between 0.01 and 0.05, and p-values are colored yellow if they are less than 0.01.
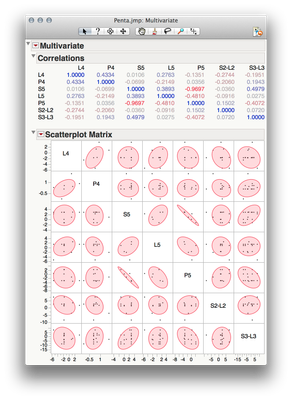
For platforms that support correlation (such as Analyze > Multivariate) conditional formatting is applied to values on the basis of the degree and direction of correlation.
I hope this helps!
Julian
Community Manager
- Mark as New
- Bookmark
- Subscribe
- Mute
- Subscribe to RSS Feed
- Get Direct Link
- Report Inappropriate Content
Re: What do the red and yellow numbers mean in the fixed effect tests
Hi mpatpc,
The coloring on p-values, conditional formatting as it's called in JMP, is based on how small the p-value is. By default, P-values are colored red if they are between 0.01 and 0.05, and p-values are colored yellow if they are less than 0.01.
For platforms that support correlation (such as Analyze > Multivariate) conditional formatting is applied to values on the basis of the degree and direction of correlation.
I hope this helps!
Julian
Recommended Articles
- © 2026 JMP Statistical Discovery LLC. All Rights Reserved.
- Terms of Use
- Privacy Statement
- Contact Us