JMP Security Notice: CVE-2026-109618 and CVE-2026-109619
JMP promptly initiated a review of its products, services, and relevant infrastructure for exposure to CVE-2026-109618 and CVE-2026-109619.
Our assessment of JMP products has not identified exposure to these vulnerabilities. Where remediation was required within supporting environments, appropriate security updates and controls have been applied and validated.
We have identified no evidence of successful exploitation or unauthorized access to JMP systems or customer information associated with these vulnerabilities.
JMP continues to monitor the issue and relevant vendor guidance. No action is required by JMP customers at this time.
Don’t miss your chance to experience Discovery Summit Europe at our best available rate! Early bird registration through 31 Oct.
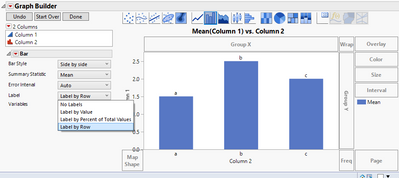
Graph Builder Toolbar streamlines interactive graphing. Creates shortcuts on Report and GraphBuilder Helpers toolbars. Download and install the extension.