- Subscribe to RSS Feed
- Mark Topic as New
- Mark Topic as Read
- Float this Topic for Current User
- Bookmark
- Subscribe
- Mute
- Printer Friendly Page
Discussions
Solve problems, and share tips and tricks with other JMP users.- JMP User Community
- :
- Discussions
- :
- Re: Understanding and Interpreting Interaction Plots
- Mark as New
- Bookmark
- Subscribe
- Mute
- Subscribe to RSS Feed
- Get Direct Link
- Report Inappropriate Content
Understanding and Interpreting Interaction Plots
Hello,
I have a question regarding the interpretation of interaction plots for interactions which were identified as statistically significant (at 95% confidence level) for a response model.
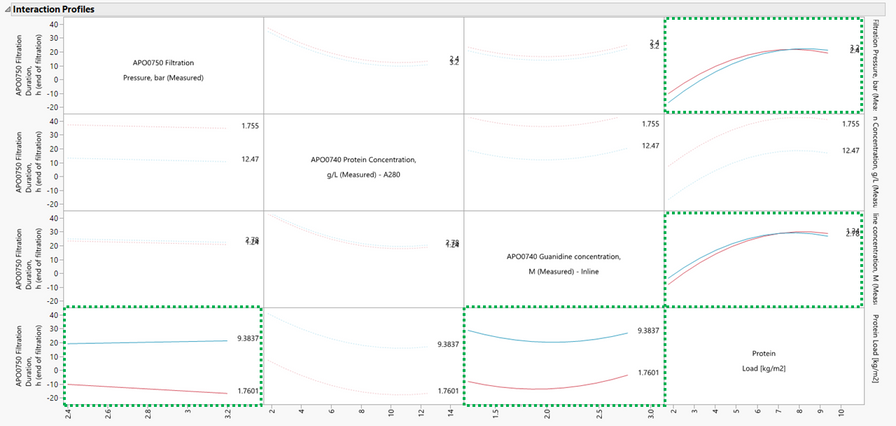
Below is a screenshot of the interaction profiles, highlighting the active interactions which had p-values less than 0.05.
In the two interaction plots in the last column, the lines are almost matching which from my perspective indicates a weak interaction. The two interaction plots in the last row which show the interactions between the same factors (factors are swapped) don't indicate any kind of interaction. Therefore, is it safe to conclude that the interactions aren't actually significant and thus can be removed from the model? Also, is this why I don't see interaction effects in the plots in the last row?
I would appreciate your thoughts.
Accepted Solutions
- Mark as New
- Bookmark
- Subscribe
- Mute
- Subscribe to RSS Feed
- Get Direct Link
- Report Inappropriate Content
Re: Understanding and Interpreting Interaction Plots
I agree that the plots in the last column indicate a small interaction. However, it could still be significant because I have no understanding of the noise of the system. So although this interaction is small, it may still be of relevance to you since it must be larger than the measured noise of your system. Is it still important to you? Is the magnitude of those differences noteworthy (don't forget the scale of the y-axis in making that decision). The lines are almost on top of each other because those factors (Filtration pressure and Guanidine concentration) do not have much of a main effect.
The graphs in the last row tell me the same thing except that those lines are far apart because the Protein load does have a large main effect.
The cells in the plot with a grayed out appearance are grayed out because that interaction term is not currently in the model.
Ultimately, do not confuse statistical significance with practical significance. You use the statistics (p-values) to guide you -- they do not make the decisions for you.
- Mark as New
- Bookmark
- Subscribe
- Mute
- Subscribe to RSS Feed
- Get Direct Link
- Report Inappropriate Content
Re: Understanding and Interpreting Interaction Plots
@Dan_ObermillerMany thanks for your answer. I strongly agree with you that protein load has a large main effect in relation to the filtration pressure and the guanidine concentration. When I remove these interaction terms from the model, I don't see a significant change in the fitting of the experimental data. From my point of view, they are not practically significant.
- Mark as New
- Bookmark
- Subscribe
- Mute
- Subscribe to RSS Feed
- Get Direct Link
- Report Inappropriate Content
Re: Understanding and Interpreting Interaction Plots
Adding to @Dan_Obermiller's explanation, I want to say that 'statistical significance' is not the same as 'strong' or 'important.'
Recommended Articles
- © 2026 JMP Statistical Discovery LLC. All Rights Reserved.
- Terms of Use
- Privacy Statement
- Contact Us


