Turn on suggestions
Auto-suggest helps you quickly narrow down your search results by suggesting possible matches as you type.
- Don’t miss your chance to experience Discovery Summit Europe at our best available rate! Early bird registration through 31 Oct.
- Graph Builder Toolbar streamlines interactive graphing. Creates shortcuts on Report and GraphBuilder Helpers toolbars. Download and install the extension.
Options
- Subscribe to RSS Feed
- Mark Topic as New
- Mark Topic as Read
- Float this Topic for Current User
- Bookmark
- Subscribe
- Mute
- Printer Friendly Page
Discussions
Solve problems, and share tips and tricks with other JMP users.- User Community
- :
- Discussions
- :
- To make a combined data table from life distribution

Level II
- Mark as New
- Bookmark
- Subscribe
- Mute
- Subscribe to RSS Feed
- Get Direct Link
- Report Inappropriate Content
To make a combined data table from life distribution
Created:
Jun 16, 2021 02:03 PM
| Last Modified: Jun 9, 2023 12:49 PM
(2472 views)
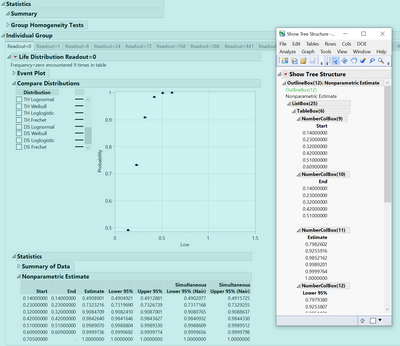
I have this report, want to make a combined data table, tried the following code, does not work, any suggestions?
rld = ld << report;
dt = rld[Table Box( 6 )] << Make Combined Data Table;
2 REPLIES 2


Staff
- Mark as New
- Bookmark
- Subscribe
- Mute
- Subscribe to RSS Feed
- Get Direct Link
- Report Inappropriate Content
Re: To make a combined data table from life distribution
Hi, here is a way to do this:
Cheers,
Brady
Names Default To Here(1);

dt1 = open("$Sample_Data\Reliability\Locomotive.jmp");

lifeDist = dt1 << Life Distribution(
	Y( :Time ),
	Censor( :censor ),
	Censor Code( 1 ),
	<<Fit Lognormal,
	Confidence Interval Method( Wald ),
	Interval Type( Simultaneous ),
	Show Event Plot Frequency Label( 0 ),
);

dt2 = report(lifeDist)[tablebox(4)] << Make Combined Data Table;
Level II
- Mark as New
- Bookmark
- Subscribe
- Mute
- Subscribe to RSS Feed
- Get Direct Link
- Report Inappropriate Content
Re: To make a combined data table from life distribution
Sorry I did not post my script, here it is, it is in the same format ad Brady shared, but I got the below error message
Subscript problem in access or evaluation of 'rld[ /*###*/Table Box(6)]' , rld[/*###*/Table Box( 46)]
ld = VT_Sweep_EVO_Sum << Life Distribution(
		Perspective( Compare Groups ),
		Y( :Low, :High ),
		Grouping( :Readout ),
		Freq( :Name( "Sum(PDF)" ) ),
		Confidence Interval Method( Wald ),
		Select Distribution( Distribution, Nonparametric ),
		Select Scale( Nonparametric ),
//		Select Distribution( Distribution, Normal ),
//		Select Scale( Normal ),
		Tabbed Report( 0 ),
		Show Survival Curve( 1 ),
		By( :Lot, :Wf, :Name( "PreconTemp(C)" ),:Name( "Precon-cycles" ),:Name( "StressTemp(C)" ),:ReadTemp ),
		SendToReport(
        Dispatch(
            {"Life Distribution - Compare Groups", "Individual Group"},
            "",
            List Box( 2 ),
            {Set Summary Behavior( "Collapse" )}
        ),
        Dispatch(
            {"Life Distribution - Compare Groups", "Individual Group"},
            "",
            List Box( 15 ),
            {Set Summary Behavior( "Collapse" )}
        )
    )
);

rld = ld << report;
dt = rld[TableBox(6)]<<Make Combined Data Table;Recommended Articles
- © 2026 JMP Statistical Discovery LLC. All Rights Reserved.
- Terms of Use
- Privacy Statement
- Contact Us