Turn on suggestions
Auto-suggest helps you quickly narrow down your search results by suggesting possible matches as you type.
- Don’t miss your chance to experience Discovery Summit Europe at our best available rate! Early bird registration through 31 Oct.
- Image to Table JMP extension imports single or batch images as data tables. Useful to extract curves from pictures or convert image data to curve data to use in analyses like Functional Data Explorer. Download and install the extension.
Options
- Subscribe to RSS Feed
- Mark Topic as New
- Mark Topic as Read
- Float this Topic for Current User
- Bookmark
- Subscribe
- Mute
- Printer Friendly Page
Discussions
Solve problems, and share tips and tricks with other JMP users.- User Community
- :
- Discussions
- :
- Re: To make a combined data table from life distribution

Level II
- Mark as New
- Bookmark
- Subscribe
- Mute
- Subscribe to RSS Feed
- Get Direct Link
- Report Inappropriate Content
To make a combined data table from life distribution
Created:
Jun 16, 2021 02:03 PM
| Last Modified: Jun 9, 2023 12:49 PM
(2509 views)
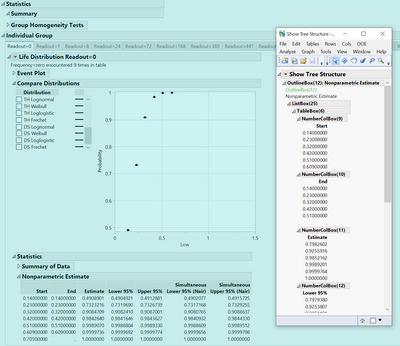
I have this report, want to make a combined data table, tried the following code, does not work, any suggestions?
rld = ld << report;
dt = rld[Table Box( 6 )] << Make Combined Data Table;
2 REPLIES 2


Staff
- Mark as New
- Bookmark
- Subscribe
- Mute
- Subscribe to RSS Feed
- Get Direct Link
- Report Inappropriate Content
Re: To make a combined data table from life distribution
Hi, here is a way to do this:
Cheers,
Brady
Names Default To Here(1);

dt1 = open("$Sample_Data\Reliability\Locomotive.jmp");

lifeDist = dt1 << Life Distribution(
	Y( :Time ),
	Censor( :censor ),
	Censor Code( 1 ),
	<<Fit Lognormal,
	Confidence Interval Method( Wald ),
	Interval Type( Simultaneous ),
	Show Event Plot Frequency Label( 0 ),
);

dt2 = report(lifeDist)[tablebox(4)] << Make Combined Data Table;
Level II
- Mark as New
- Bookmark
- Subscribe
- Mute
- Subscribe to RSS Feed
- Get Direct Link
- Report Inappropriate Content
Re: To make a combined data table from life distribution
Sorry I did not post my script, here it is, it is in the same format ad Brady shared, but I got the below error message
Subscript problem in access or evaluation of 'rld[ /*###*/Table Box(6)]' , rld[/*###*/Table Box( 46)]
ld = VT_Sweep_EVO_Sum << Life Distribution(
		Perspective( Compare Groups ),
		Y( :Low, :High ),
		Grouping( :Readout ),
		Freq( :Name( "Sum(PDF)" ) ),
		Confidence Interval Method( Wald ),
		Select Distribution( Distribution, Nonparametric ),
		Select Scale( Nonparametric ),
//		Select Distribution( Distribution, Normal ),
//		Select Scale( Normal ),
		Tabbed Report( 0 ),
		Show Survival Curve( 1 ),
		By( :Lot, :Wf, :Name( "PreconTemp(C)" ),:Name( "Precon-cycles" ),:Name( "StressTemp(C)" ),:ReadTemp ),
		SendToReport(
        Dispatch(
            {"Life Distribution - Compare Groups", "Individual Group"},
            "",
            List Box( 2 ),
            {Set Summary Behavior( "Collapse" )}
        ),
        Dispatch(
            {"Life Distribution - Compare Groups", "Individual Group"},
            "",
            List Box( 15 ),
            {Set Summary Behavior( "Collapse" )}
        )
    )
);

rld = ld << report;
dt = rld[TableBox(6)]<<Make Combined Data Table;Recommended Articles
- © 2026 JMP Statistical Discovery LLC. All Rights Reserved.
- Terms of Use
- Privacy Statement
- Contact Us