- Subscribe to RSS Feed
- Mark Topic as New
- Mark Topic as Read
- Float this Topic for Current User
- Bookmark
- Subscribe
- Mute
- Printer Friendly Page
Discussions
Solve problems, and share tips and tricks with other JMP users.- JMP User Community
- :
- Discussions
- :
- Split table is shifting some values
- Mark as New
- Bookmark
- Subscribe
- Mute
- Subscribe to RSS Feed
- Get Direct Link
- Report Inappropriate Content
Split table is shifting some values
Hi I have this table (attached) to which I've saved the script from the split function.
Essentially the main table has for each sample 2 measurements for each target, "mean_numeric" and "value", each sample has 2 replicates and the 2 measurements should be the same (and are the same as far as I'm aware).
I want to reformat the table using split so for each sample I have a row and then each target measurement is a column, and since there are 2 replicates there should be 2 identical rows, however for some reason some of the target measurement values are getting shifted:
Rows 17 and 18 should have the same values as they are the same sample, and they do on the first column but then it switches to 16 and 17 having the same values. Why is this happening?
Here is how I use the split function:
Many thanks!
Edit: I'm aware I could remove the duplicates from the main table and then split however I'm only showing a snippet of the data, there are other columns that are different across the replicates. And I'd also like to understand what's happening with the split function.
- Mark as New
- Bookmark
- Subscribe
- Mute
- Subscribe to RSS Feed
- Get Direct Link
- Report Inappropriate Content
Re: Split table is shifting some values
I suspect that you need to specify a Group variable(s) to define what each row of your output should be defined by
- Mark as New
- Bookmark
- Subscribe
- Mute
- Subscribe to RSS Feed
- Get Direct Link
- Report Inappropriate Content
Re: Split table is shifting some values
Yes that works, but it still feels like there is a bug / something isn't working as expected with the split function. If I use the group function I only get one row per replicate rather than 2.
Thanks for the suggestion though
- Mark as New
- Bookmark
- Subscribe
- Mute
- Subscribe to RSS Feed
- Get Direct Link
- Report Inappropriate Content
Re: Split table is shifting some values
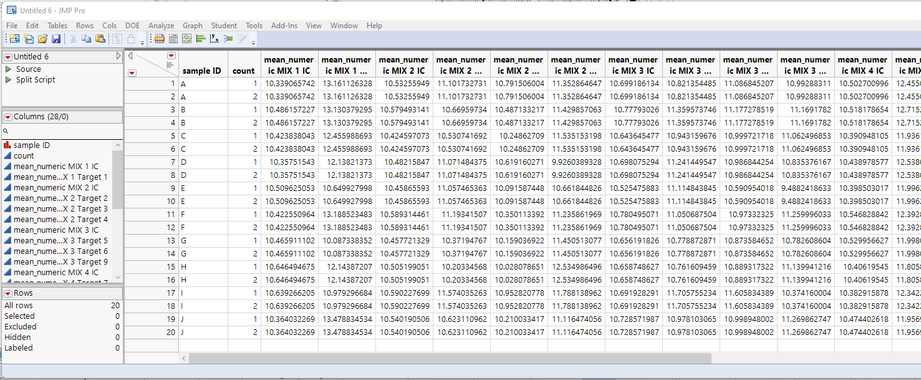
I think the issue is not having the Group variable(s) defined properly. Looking closer, I believe that if you create a new column and add it to the Group specification, you will get what you want. I would like for you to try the following:
- Sort the data table by Sample ID and mean_numeric
- Add a new column to your table
- Name it "count"
- Apply this formula Col Cumulative Sum( 1, :sample ID, :mean_numeric )
- Now split the data as before, except, set the Group selection to both "sample ID" and "count"
Here is the table I get
- Mark as New
- Bookmark
- Subscribe
- Mute
- Subscribe to RSS Feed
- Get Direct Link
- Report Inappropriate Content
Re: Split table is shifting some values
Thank you, that works. I'll bear in mind that the results of the split function may be wrong without using a grouping variable.
Recommended Articles
- © 2026 JMP Statistical Discovery LLC. All Rights Reserved.
- Terms of Use
- Privacy Statement
- Contact Us


