- Learn how to build custom Python data connectors and further customize JMP’s Data Connector Framework with the Python Data Connector Demo, available now in the JMP Marketplace!
- See how to move from signal modeling to system modeling at the first JMP Aerospace Analytics webinar. Register. June 18, 1 p.m. US Eastern Time.
- Subscribe to RSS Feed
- Mark Topic as New
- Mark Topic as Read
- Float this Topic for Current User
- Bookmark
- Subscribe
- Mute
- Printer Friendly Page
Discussions
Solve problems, and share tips and tricks with other JMP users.- JMP User Community
- :
- Discussions
- :
- Split plots

- Mark as New
- Bookmark
- Subscribe
- Mute
- Subscribe to RSS Feed
- Get Direct Link
- Report Inappropriate Content
Split plots
I am helping a colleague analyze some data, and he set up his experiment in a simple manner, but one in which I have never seen. He had reef corals in aquaria and wanted to see under which conditions they grow best. Normally, you would have many tanks, each with its own set of conditions, but he used huge tanks (to make them more "reef-like") in which conditions varied WITHIN tank. I am specifically referring to light. He basically positioned the corals at three depths so that they would receive different light levels. To me, this would appear to be a classic example of a split plot design, but what's strange to me is that there is really only the tank (whole plot) and light within tank as the subplot, whereas most examples I've seen are one treatment effectively nested within another. After watching a fantastic webinar on JMP's mixed model platform by Jian Cao (https://www.jmp.com/en_us/events/ondemand/mastering-jmp/linear-mixed-models-using-jmp-pro.html), which I have watched no less than 5-7 times in its entirety, it would appear that I would simply need to nest tank within light under the "random" mixed-model dialog to accommodate the split plot design. The design is actually more complicated because there is a temporal element, and repeated measures undertaken on corals that were assessed at different time points, but JMP can handle that as long as you use a repeated measures platform that permits random effects (e.g., unequal variances but not unstructured).
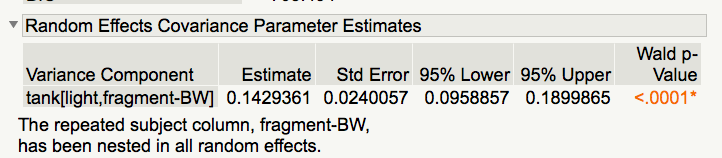
What I am confused about (assuming my nesting of tank within light was correct), is the output: JMP automatically nested my repeated measure (the coral fragments assessed over time) within my random effect (see image). And it has been presented as light(tank) rather than tank(light). Why does the repeated measure get nested within the split plot, and is the fact that the Wald p-value is highly significant telling me that my variation due to random and repeated factors is so high as to be problematic?

- Mark as New
- Bookmark
- Subscribe
- Mute
- Subscribe to RSS Feed
- Get Direct Link
- Report Inappropriate Content
Re: Split plots
IMHO, you are not dealing with a split-plot design. You have light nested within tank; light(tank). It would be physically impossible to nest tank within light as you have described it. The multiple measures over time can be evaluated multiple ways:
1. Create a response variable that describes the change in growth over time (perhaps the slope of the line, or some other rate of change metric),
2. Treat each time response as a separate response variable,
3. Treat the time as a random variable in the model (which would be unassignable)
I take it from your description that at each time period, you also have multiple measures of the corals. These would be repeats and can be used to assess the measurement system (possibly confounded with within coral variability).
- Mark as New
- Bookmark
- Subscribe
- Mute
- Subscribe to RSS Feed
- Get Direct Link
- Report Inappropriate Content
Re: Split plots
- Mark as New
- Bookmark
- Subscribe
- Mute
- Subscribe to RSS Feed
- Get Direct Link
- Report Inappropriate Content
Re: Split plots
Hello,
Thank you for looking at that. I'm attaching the data table with a script since that might explain it better. BW=buoyant weight (coral size), and Fv/Fm and color are two additional response variables. I think I have the repeated measures part set up right (the coral fragment is the subject that is repeatedly assessed over time). I guess I was thinking that the tank was literally split into three plots so I would need to accommodate that somehow in the model since one could argue that the within-tank light levels aren't independent of one another since they are within the same replicate block (i.e., the tank). The fact of the matter is that the feeding effect is so strong that no matter what the final model is, the results hardly change, but I still want to make sure I present it correctly! Maybe what will be important to show is the interaction of tank and light(tank) to ensure that light effects were similar across tanks. I've never set up an experiment like this, so I'm still trying to wrap my head around it!
- Mark as New
- Bookmark
- Subscribe
- Mute
- Subscribe to RSS Feed
- Get Direct Link
- Report Inappropriate Content
Re: Split plots
Anderson,
The data set attached did not have any scripts attached?
I don't know what would be a practical change in any of the response variables? So look at the data first. Is there any practical significance to the changes in the response variables
I have re-attached your data set with 7 scripts:
1. Multivariate looking at the 3 response variables (Mahalonobis outlier plot as well). Note some of the outliers. Should those responses correlate?
2. Simple graph builder (2 ways) to look at the data before you worry too much about the statistical tests
3. Variability plot 3 response variables (colored by Food)
4. Range chart for repeats (I believe there are 5?)
I also summarized the data with my best guess (Data Summary). This can be further analyzed, but you need to look it over before doing so.
- Mark as New
- Bookmark
- Subscribe
- Mute
- Subscribe to RSS Feed
- Get Direct Link
- Report Inappropriate Content
Re: Split plots
- Mark as New
- Bookmark
- Subscribe
- Mute
- Subscribe to RSS Feed
- Get Direct Link
- Report Inappropriate Content
Re: Split plots
- Mark as New
- Bookmark
- Subscribe
- Mute
- Subscribe to RSS Feed
- Get Direct Link
- Report Inappropriate Content
Re: Split plots
Thanks so much for spending all this time looking at my data. Allow me to answer some of your questions.
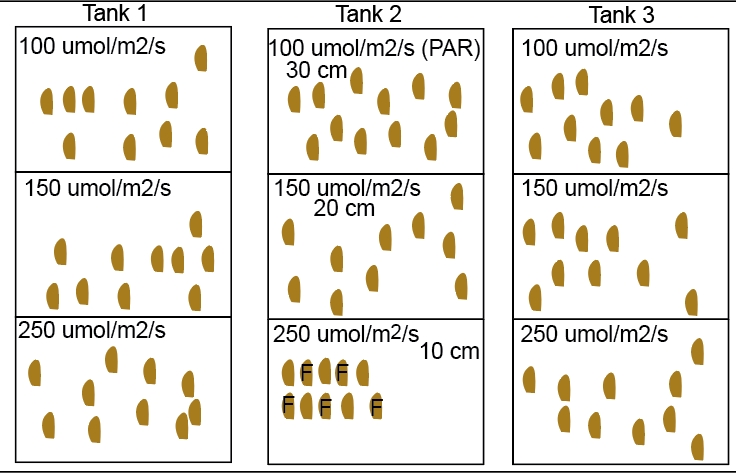
The experimental design is basically: 5 coral colonies broken up into 25 2-g fragments, a subset of 18 of which were used in experiments (n=90 coral fragments). I actually took some of Jian Cao's suggestions to look at the nesting random coefficients feature to ensure that the corals essentially all started off similarly (this could very well NOT be the case since different fragments could display differentially recovery from being torn off their parent colony).
30 corals fragments were placed in each of three tanks. Within each tank, 10 fragments were placed at each of three depths (which correspond to different light levels). Half of the 10 colonies in each light x tank group are fed. Feed is actually done by transporting them somewhere else, so it's not as if there is a physically stratified light x food "bin" in each tank. So "bin" in my table is actually just "tank x light x food" = 3 x 3 x 2 = 18 bins, each with 5 fragments. In other words, there are six fixed-factor treatments (food x light groups) with three tanks. So I think you are right: it is tank as the whole plot and light x food as the within-tank subplot. Fragment is the repeated subject and time is the repeated measure. Does that mean that, under random effects in the mixed model platform, I should include tank AND light x food(tank)? I think it is just the latter since light x food(tank) is literally the whole design (subplot nested within whole plot). I have attached a new data table with this script. The last one perhaps didn't save properly.
Your figures look similar to mine. What jumps out is that food seems to have a stronger effect than light. That is the main point of the study, in fact. I had never seen these control and variability plots before, but this could be a good way of showing relative influence of time and tank. I usually use predictor screening or fit-model+random effects for all parameters to get at this in a different way (i.e., which factors drove the most variation in your responses). Actually, if you look at BW alone, light has a stronger effect than food (which is not significant), which is why the "specific growth rate" found in the second table I'm attaching might be the way to go (i.e., relative rate of size increase rather than raw size data).
Two factors correlate so much as to be redundant. I think I didn't include one of them (TLE) in the file I sent. Basically, we looked at size 2-3 different ways since analyzing size of corals is surprisingly disputed. But in the end, they respond similarly to treatment. Fv/Fm is a proxy for photosynthesis, and, while statistically significant, we are talking about a range of 0.7=mean low to 0.74=mean high. I literally wrote a sentence in the manuscript saying that "Although highly significantly influenced by the experimental factors, it was unclear whether such differences are biologically relevant." The photosynthesis people will butcher me because it has become the norm to build huge stories on minuscule changes in this response variable (which I obviously disagree with). In contrast, the weight increased from 2 g to 9 g over 140 days (over 4-fold), which will likely to be the selling point of the whole paper because it's unprecedentedly high.
I have been box-cox transforming the decidedly non-normally distributed data. The color scores are themselves essentially ranks, which I guess makes the color analysis non-parametric.
The second file "linear extension split by time" is really the "meat" because this reflects all the data as a relative or percent change (i.e., the temporal element has been removed). The exception is Fv/Fm, where I just show the file data. One could argue that the actual time by time temporal changes are less important (and will probably end up as an online supplemental figure) vs. the overall effects shown in this second table so I am going to try out the aforementioned split plot with this table (as well as with your pooled summary file).
- Mark as New
- Bookmark
- Subscribe
- Mute
- Subscribe to RSS Feed
- Get Direct Link
- Report Inappropriate Content
Re: Split plots
If you'll indulge me, I have some additional comments/questions:
1. As is often the case, the situation is difficult to communicate and more complicated than originally described. This is not meant to be an indictment. I often suggest graphically describing the sampling plan. I originally thought there was only 1 tank. No idea what a bin or fragment was...I am just now recognizing the feeding was not done randomly and that it also required moving to another tank?
Realize that ALL conclusions, tools to analyze, questions that can be answered, confidence in your ability to extrapolate DEPEND on how you acquired the data.
2. Did you happen to measure the light transmittance between the 3 depths? Why did you use 3 depths? Why not 2 extremes to estimate the effect?
3. I found multiple instances of unusual data points (special cause like). Those should be understood and then properly handled before doing any quantitative analysis. I did not summarize those other Y's in that file I attached earlier. I really think you need to consider those "outliers" before you summarize.
4. I always "preach" analysis should follow 3 steps:
- Practical: Does the data make sense? How does it compare with predictions made? Any obvious patterns? Did the response variable vary enough to be meaningful? Practical significance is ALWAYS more important than statistical significance.
- Graphical: You are looking for patterns in the response variable and matching those patterns to changes in the independent variables. This is best done graphically.
- Quantitative: OK, so you want to increase your confidence in the results. I think of quantitative analysis for 2 purposes: 1. Did I miss some pattern, 2. Is the pattern I see really there?
5. Any time you have subjective evaluation, you need to think consider the within and between inspector errors. Yes, the color scale is an ordinal data set. Using an ordinal scale for sensory perception can be greatly improved with some thought. I wrote some notes on the topic and attached those notes.
6. George Box once told me, paraphrased: The only reason to do transformation is to simplify the model, not to improve statistical analysis.
- Mark as New
- Bookmark
- Subscribe
- Mute
- Subscribe to RSS Feed
- Get Direct Link
- Report Inappropriate Content
Re: Split plots
Thanks for the advice and suggestions. I should have explained the experiment better in the initial post. I am guessing they opted for this strange design because the aquaria are so large and so hard to maintain, so they opted to have a few large ones with split plots, rather than 10-20 individual ones. In fact, the strange nature of their design was the main impetus of my post to begin with!
Even when pooling the data across fragments within each tank x light x food (n=18 samples) in the summary file, you can still see 1-2 multivariate outliers. One of them I had already flagged from the PCA because it basically sits off by itself. It seems to be the growth data that are driving it, so I will need to ask the student about it. Maybe some fragments were dying.
They measured light at the three levels (100, 150, and 250 umol/m2/s photosynthetically active radiation), so I am not concerned about that except if one were to argue that, because the depths were inherently different (30, 20, and 10 cm, respectively) this could bias findings. This is a legitimate concern if something else varied across depths (like flow). If nothing else, it's been a learning experience for me because I have never seen an experiment set up this way! Anyway, thanks for all your help and advice.
Recommended Articles
- © 2026 JMP Statistical Discovery LLC. All Rights Reserved.
- Terms of Use
- Privacy Statement
- Contact Us