- Instantly extract effect sizes, F-ratios, and FDR-adjusted p-values from your models with the Calculate Effects Sizes extension, available now in the JMP Marketplace!
- New to JMP? Join us Sept. 23-24 for the Early User Edition of Discovery Summit, tailor-made for new users. Register now for free!
- See how to use the JMP Marketplace – Free tools to expand JMP capabilities. Register. July 10, 2 pm US Eastern Time.
- Subscribe to RSS Feed
- Mark Topic as New
- Mark Topic as Read
- Float this Topic for Current User
- Bookmark
- Subscribe
- Mute
- Printer Friendly Page
Discussions
Solve problems, and share tips and tricks with other JMP users.- JMP User Community
- :
- Discussions
- :
- Spec limits issue

- Mark as New
- Bookmark
- Subscribe
- Mute
- Subscribe to RSS Feed
- Get Direct Link
- Report Inappropriate Content
Spec limits issue
Hi,
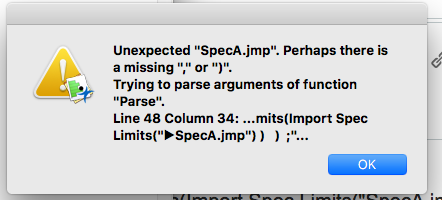
I am trying to import spec limits and having some error when I ran the script. Here is the script and error:
dt = Current Data Table();
Eval(
Parse(
"obj = dt << Process Capability(
Process Variables( "|| names ||
" ),
Spec Limits(Import Spec Limits("SpecA.jmp") ) ) ;"
)
);
The names varaible has all columns and worked fine in other script. I appreciate any help.
- Mark as New
- Bookmark
- Subscribe
- Mute
- Subscribe to RSS Feed
- Get Direct Link
- Report Inappropriate Content
Re: Spec limits issue
Thanks Jim. I like to be able to import the spec limit and show histogram with spec limit and also Cpk analysis.
I wrote the following script and it does not show the histogram:
dt = Current data table();
obj = Capability(
Y( :A ),
Spec Limits( Import Spec Limits( "$Documents/JMP/SpecA.jmp" ) ),
Individual Detail Reports( 1 ),
Capability Box Plots( 0 ),
Goal Plot( 0 )
);
obj << Distribution( Continuous Distribution( Column( : A),
Capability Analysis( 1 ) ) );
obj << Histogram(1, Show Spec Limits(1));
I appreciate your further help. Thanks

- Mark as New
- Bookmark
- Subscribe
- Mute
- Subscribe to RSS Feed
- Get Direct Link
- Report Inappropriate Content
Re: Spec limits issue
The Capability Platform does not automatically save the Spec Limits to the column properties. They have to have the message
obj << Save Spec Limits as Column Properties.specified.
Then, you can run the Distribution Platform. But contrary to how you have it listed, the Distribution is not passed to the Object associated with the Capability Platform, it is passed to the data table
Names Default To Here( 1 );
dt = Open( "$SAMPLE_DATA/Cities.jmp" );
obj = dt << Capability(
	Y( :OZONE, :CO, :SO2, :NO ),
	Spec Limits(
		Import Spec Limits(
			"$SAMPLE_DATA/CitySpecLimits.jmp"
		)
	)
);
obj << Save Spec Limits as Column Properties;

Dis = dt << Distribution(
	Continuous Distribution( Column( :OZONE ) ),
	Continuous Distribution( Column( :CO ) ),
	Continuous Distribution( Column( :SO2 ) ),
	Continuous Distribution( Column( :NO ) )
);
This is all detailed in the message documentation in the Scripting Index
Help==>Scripting Index==>Capability
- Mark as New
- Bookmark
- Subscribe
- Mute
- Subscribe to RSS Feed
- Get Direct Link
- Report Inappropriate Content
Re: Spec limits issue
Thanks Jim. That's very helpful.
Can you choose the columns you want to do the histogram in the script? It looks like you have to list them one by one using Continuous Distribution.
I appreciate any help/comments. Thanks
- Mark as New
- Bookmark
- Subscribe
- Mute
- Subscribe to RSS Feed
- Get Direct Link
- Report Inappropriate Content
Re: Spec limits issue
You question how to enter the column specification for the Distribution Platform. The syntax that is required to run any given platform can be determined by
1. Running the platform interactively, and then saving the script, and examining it for what is required to run multiple columns.
2. To to
Help==>Scripting Index
and then go to the Platform of choice (i.e. Distribution) and going through the various examples provided in the index.
- Mark as New
- Bookmark
- Subscribe
- Mute
- Subscribe to RSS Feed
- Get Direct Link
- Report Inappropriate Content
Re: Spec limits issue
Thanks Jim. I went through that and found somethig like this script:
Column Dialog(
ex y = ColList( "Y", Min Col( 1 ), Max Col( 80 ), Data Type( "Numeric" ) ),
ex x = ColList( "X", Max Col( 1 ), Modeling Type( {"Continuous", "Multiple Response"} ) )
);
How do I use the above column selection to do Distribution/Histogram for instance.
Thanks.
- Mark as New
- Bookmark
- Subscribe
- Mute
- Subscribe to RSS Feed
- Get Direct Link
- Report Inappropriate Content
Re: Spec limits issue
The Column Dialog() function has been downgraded in importance in favor of using a New Window. Here is an example of one way to choose columns and to pass them to a Platform. This example is taken from
Help==>Books==>Scripting Guide, page 445
dt = Open( "$SAMPLE_DATA/Big Class.jmp" );
xvar = .;
yvar = .;
win = New Window( "Return Values",
	<<Modal,
	<<On Validate(
// require the user to select two variables before clicking OK
		Show( xvar, yvar );
		If( Is Missing( xvar ) | Is Missing( yvar ),
			0, // if xvar or yvar are missing, do nothing when OK is clicked
			1
		);
	),
	Text Box( " Select two numeric columns. " ),
	H List Box(
		Text Box( " X, Factor " ),
		x = Col List Box(
			dt, // data table reference
			all, // display all columns from the data table
			xvar = (x << Get Selected)[1];
// get the name of the selected column before the window closes
			Show( xvar );
		),
		Text Box( "Y, Response" ),
		y = Col List Box(
			dt,
			all,
			yvar = (y << Get Selected)[1];
			Show( yvar );
		)
	)
);
xcol = Column( dt, xvar ); // get the columns
ycol = Column( dt, yvar );
dt << Bivariate( Y( ycol ), X( xcol ) ); // create a Bivariate plot- Mark as New
- Bookmark
- Subscribe
- Mute
- Subscribe to RSS Feed
- Get Direct Link
- Report Inappropriate Content
Re: Spec limits issue
Thanks Jim. I made it to work.
- « Previous
-
- 1
- 2
- Next »
Recommended Articles
- © 2026 JMP Statistical Discovery LLC. All Rights Reserved.
- Terms of Use
- Privacy Statement
- Contact Us