cancel
Showing results for 
Show  only  | Search instead for 
Did you mean: 
  • Don’t miss your chance to experience Discovery Summit Europe at our best available rate! Early bird registration through 31 Oct.
  • Graph Builder Toolbar streamlines interactive graphing. Creates shortcuts on Report and GraphBuilder Helpers toolbars. Download and install the extension.
  • JMP will suspend normal business operations for our Rest and Recharge Day on Friday, October 2, 2026.
    Regular business hours will resume on Monday, October 5, 2026.

Discussions

Solve problems, and share tips and tricks with other JMP users.
Choose Language Hide Translation Bar
evtran
Level II

Simulation Experiment

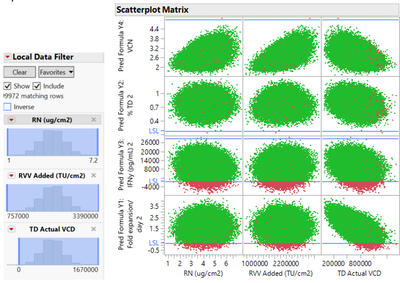
I used prediction profiler to find parameters to maximize desirability, then simulated to table. Then I was taught in a JMP class to "use TLC drop down toolbar, click Edge of Failure script". I think it might be from an add-on, but I don't know how to get there again. 
evtran_0-1698703188973.png

This I was taught to use to narrow Factors until I get below a certain OOS failure rate. It's a nice feature and visual graph, but I can't figure out how to make it again.


1 REPLY 1

Re: Simulation Experiment

Click the red triangle next to Prediction Profiler and select Design Space Profiler.

Recommended Articles