- Don’t miss your chance to experience Discovery Summit Europe at our best available rate! Early bird registration through 31 Oct.
- Graph Builder Toolbar streamlines interactive graphing. Creates shortcuts on Report and GraphBuilder Helpers toolbars. Download and install the extension.
- JMP will suspend normal business operations for our Rest and Recharge Day on Friday, October 2, 2026.
Regular business hours will resume on Monday, October 5, 2026.
- Subscribe to RSS Feed
- Mark Topic as New
- Mark Topic as Read
- Float this Topic for Current User
- Bookmark
- Subscribe
- Mute
- Printer Friendly Page
Discussions
Solve problems, and share tips and tricks with other JMP users.- User Community
- :
- Discussions
- :
- Script for Error Bar Line Color in Graph Builder

- Mark as New
- Bookmark
- Subscribe
- Mute
- Subscribe to RSS Feed
- Get Direct Link
- Report Inappropriate Content
Script for Error Bar Line Color in Graph Builder
Hello,
I have a fairly simple problem, but cannot find the answer in the scripting guide. I created a temperature graph in graph builder using hourly temperature data. I used a line graph to show the daily mean and added error bars to show the range of daily temperatures. The error bars are the same color as the line graph which makes the mean line hard to see. To get around this, I right-click on the graph and select "customize". From the customize window, I can change the color of the error bars from black to gray and move up error bar in the drawing order. This makes the graph exactly how I want it. However, the customizations do not get carried over to the script. Whenever I save the script and run it again or change the date range of the graph, it goes back to the way it was before I customized it. Is there a way I can save these customizations in the script?
Thanks!
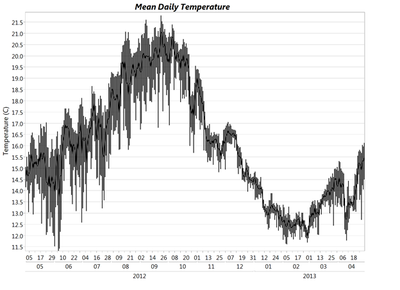
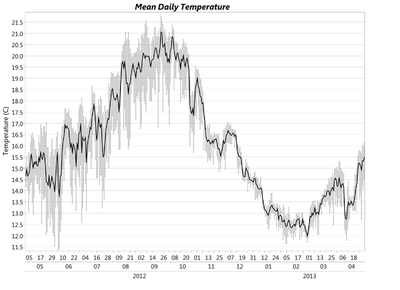
Graph Builder(
Size( 1210, 948 ),
Show Legend( 0 ),
Legend Position( "Bottom" ),
Variables( X( :Date 2 ), Y( :Mean Daily Temp ) ),
Elements(
Line(
X,
Y,
Legend( 11 ),
Row order( 0 ),
Summary Statistic( "Mean" ),
Error Bars( "Range" )
)
),
Local Data Filter(
Location( {1920, 0} ),
Mode( Select( 0 ), Show( 1 ), Include( 1 ) ),
Add Filter(
columns( :Date 2, :Site ),
Where( :Date 2 >= 01May2012 & :Date 2 <= 30Apr2013 ),
Where( :Site == "AP" ),
Display( :Date 2 ),
Display( :Site, Size( 204, 234 ), List Display )
)
),
SendToReport(
Dispatch(
{},
"Date 2",
ScaleBox,
{Min( 3418641920 ), Max( 3450091520 ), Interval( "Day" ), Inc( 6 ),
Minor Ticks( 0 ), Label Row Nesting( 3 ), Show Minor Ticks( 0 )}
),
Dispatch(
{},
"Mean Daily Temp",
ScaleBox,
{Min( 11.3154759267269 ), Max( 21.9381773452312 ), Inc( 0.5 ),
Minor Ticks( 0 ), Show Major Grid( 1 ), Show Minor Ticks( 0 )}
),
Dispatch(
{},
"400",
ScaleBox,
{Legend Model(
11,
Level Name( 0, "mean daily temp" ),
Properties( 0, {Line Color( 0 ), Fill Color( 0 )} )
)}
),
Dispatch(
{},
"graph title",
TextEditBox,
{Set Text( "Mean Daily Temperature" )}
),
Dispatch( {}, "X title", TextEditBox, {Set Text( "" )} ),
Dispatch( {}, "Y title", TextEditBox, {Set Text( "Temperature (C)" )} ),
Dispatch(
{},
"Graph Builder",
FrameBox,
{Grid Line Order( 1 ), Reference Line Order( 4 )}
)
)
);


- Mark as New
- Bookmark
- Subscribe
- Mute
- Subscribe to RSS Feed
- Get Direct Link
- Report Inappropriate Content
Re: Script for Error Bar Line Color in Graph Builder
The following example script demonstrates how you can use XPath() to navigate the XML representation of the display tree to set the desired line color for the error bars. I will report to the JMP Development team that saving the script does not retain the error bar colors.
Hope this helps!
dt = Open("$SAMPLE_DATA\S4 Temps.jmp");
gb = dt << Graph Builder(
Show Control Panel( 0 ),
Variables( X( :sector ), X( :time of day, Position( 1 ) ), Y( :fahrenheit ) ),
Elements(
Line(
X( 1 ),
X( 2 ),
Y,
Legend( 4 ),
Row order( 0 ),
Summary Statistic( "Mean" ),
Error Bars( "Range" )
)
)
);
(gb << xpath( "//FrameBox/BarSeg" )) << Set Line Color( "Gray" );
Recommended Articles
- © 2026 JMP Statistical Discovery LLC. All Rights Reserved.
- Terms of Use
- Privacy Statement
- Contact Us