- New to JMP? Join us Sept. 23-24 for the Early User Edition of Discovery Summit, tailor-made for new users. Register now for free!
- Your voice matters! Tell us how you prefer to receive JMP updates, so we can tailor our communication to your needs. Take short survey.
- See how to access JMP Marketplace - and - find, create & share add-ins to extend your JMP. Watch video.
- Subscribe to RSS Feed
- Mark Topic as New
- Mark Topic as Read
- Float this Topic for Current User
- Bookmark
- Subscribe
- Mute
- Printer Friendly Page
Discussions
Solve problems, and share tips and tricks with other JMP users.- JMP User Community
- :
- Discussions
- :
- Save Summaries for multiple graphs in one report using JSL

- Mark as New
- Bookmark
- Subscribe
- Mute
- Subscribe to RSS Feed
- Get Direct Link
- Report Inappropriate Content
Save Summaries for multiple graphs in one report using JSL
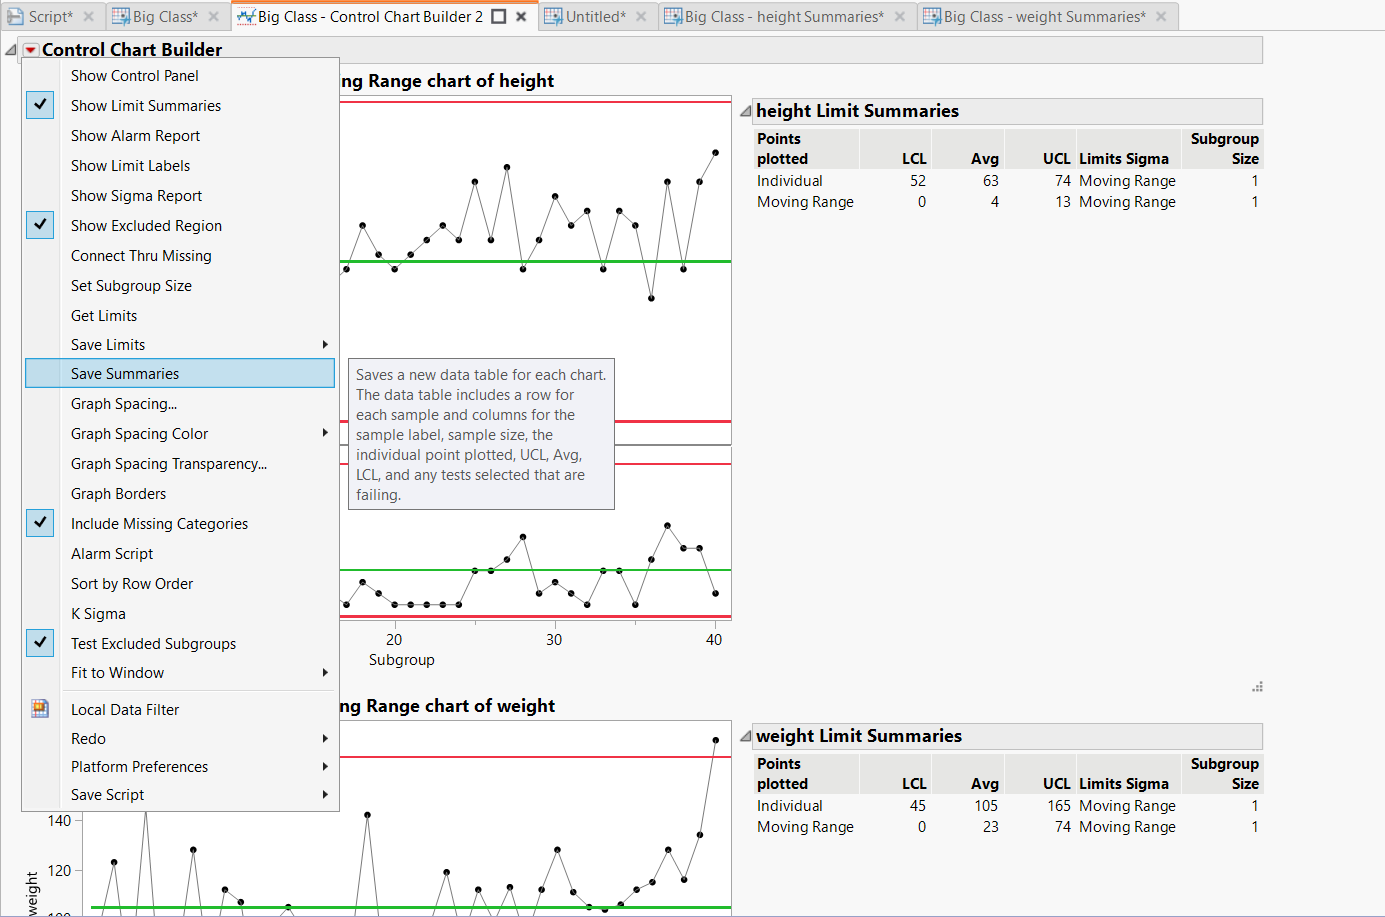
I have a report which I run that spits out anywhere between 2 and 26 graphs into a report tab so they can all be viewed at one time, in one tab. I'd like to find a way get it to export the Save Summaries for all of the graphs in the report using JSL. At the current time, I just CTRL + click the button in the attached image and it exports everything I need into many data tables.
Is there a way I can force JMP to pull the Save Summaries on a report just using JSL? Pulling the summaries into data tables one by one would be fine. All of the other examples that I have seen include assigning the Control Chart Builder to an object, then saving those summaries. I would prefer not to do that but can if that's my only option.
Thanks!
- Tags:
- windows
Accepted Solutions

- Mark as New
- Bookmark
- Subscribe
- Mute
- Subscribe to RSS Feed
- Get Direct Link
- Report Inappropriate Content
Re: Save Summaries for multiple graphs in one report using JSL
Below are three suggestions in the order I would try them.
You could try scripting Make Combined Data table

Names Default To Here(1);

dt = Open("$SAMPLE_DATA/Big Class.jmp");

nw = New Window("Charts",
	For(i = 1, i <= N Row(dt), i++,
		name = dt:Name[i];
		obj = dt << Control Chart Builder(
			Variables(Y(:height, :weight)),
			Show Control Panel(0),
			SendToReport(
				Dispatch(
					{},
					"graph display 1 title",
					TextEditBox,
					{Set Text(name || " Individual & Moving Range chart of height")}
				)
			)
		);
	)
);

dt_summaries = nw["Control Chart Builder", "height Limit Summaries", Table Box(1)] << Make Combined Data Table;
Or you could store references to those control chart builders during loop and then loop again with Save Summaries (you should most likely save values inside the loop and then close the tables):
Names Default To Here(1);

dt = Open("$SAMPLE_DATA/Big Class.jmp");

ccb_list = {};

nw = New Window("Charts",
	For(i = 1, i <= N Row(dt), i++,
		name = dt:Name[i];
		obj = dt << Control Chart Builder(
			Variables(Y(:height, :weight)),
			Show Control Panel(0),
			SendToReport(
				Dispatch(
					{},
					"graph display 1 title",
					TextEditBox,
					{Set Text(name || " Individual & Moving Range chart of height")}
				)
			)
		);
		Insert Into(ccb_list, obj);
	);
);

For(i = 1, i <= N Items(ccb_list), i++,
	dt_temp = ccb_list[i] << Save Summaries;
	show(dt_temp);
	//Close(dt_temp, no save);
);
Or you can use XPath to get the references (and them I would again loop to avoid opening too many tables)
Names Default To Here(1);

dt = Open("$SAMPLE_DATA/Big Class.jmp");

nw = New Window("Charts",
	For(i = 1, i <= N Row(dt), i++,
		name = dt:Name[i];
		obj = dt << Control Chart Builder(
			Variables(Y(:height, :weight)),
			Show Control Panel(0),
			SendToReport(
				Dispatch(
					{},
					"graph display 1 title",
					TextEditBox,
					{Set Text(name || " Individual & Moving Range chart of height")}
				)
			)
		);
	);
);

//((nw << XPath("//OutlineBox[text()='Control Chart Builder']")) << get scriptable object) << Save Summaries;
If the << save summaries does open more than one table, you might have to use something like Get Data Table List(); to see which are the new ones, handle them and then close them.

- Mark as New
- Bookmark
- Subscribe
- Mute
- Subscribe to RSS Feed
- Get Direct Link
- Report Inappropriate Content
Re: Save Summaries for multiple graphs in one report using JSL
Right-click on one of the summary tables and select Make Into Combined Table. Does that work for you?
- Mark as New
- Bookmark
- Subscribe
- Mute
- Subscribe to RSS Feed
- Get Direct Link
- Report Inappropriate Content
Re: Save Summaries for multiple graphs in one report using JSL
Thanks for the suggestion!
I am not actually using Summary Tables for this, I am trying to use the "Save Summaries" button on the Control Chart Builder using JSL. I need to save the summaries of many graphs that exist within a single report tab. Please let me know if I can provide any further info about this, thanks!
- Mark as New
- Bookmark
- Subscribe
- Mute
- Subscribe to RSS Feed
- Get Direct Link
- Report Inappropriate Content
Re: Save Summaries for multiple graphs in one report using JSL
Do you want to save all the summaries that appear to the right of the control chart? Do you want the summaries together in one data table?

My previous suggestion will put all of that information in one data table that looks like this for my example:

This code illustrates how to achieve this result from a script:
Names Default to Here( 1 );

dt = Open( "$SAMPLE_DATA/Big Class.jmp" );

ccb = dt << Control Chart Builder( Variables( Y( :height, :weight ) ), Show Control Panel( 0 ) );

summary = Report( ccb )[TableBox(1)] << Make Combined Data Table;- Mark as New
- Bookmark
- Subscribe
- Mute
- Subscribe to RSS Feed
- Get Direct Link
- Report Inappropriate Content
Re: Save Summaries for multiple graphs in one report using JSL
@Mark_Bailey thank you for this! I see that this can be very helpful for getting a summary of the whole graph for multiple graphs in one report. However, if possible I would love to be able to get the summaries of each point on each graph. Exactly how it works when using the button in the attached image.
Is this possible to do using JSL?
I see now that this works when using this: summary = Report( ccb ) << Save Summaries;
However, I have another layer to my data set which makes this less straight forward. In my data set, more than just a single Control Chart Builder is used in the report based on how many rows there are in another table. So when running << Save Summaries on the object I assigned the control chart builder to, I get only the summaries for the last made chart, rather than all of them. Is there any way to tell JMP to look at the other charts so I can save those summaries?
I will be trying to adapt the Big Class data set in the meantime to make clearer what I am looking to do.
- Mark as New
- Bookmark
- Subscribe
- Mute
- Subscribe to RSS Feed
- Get Direct Link
- Report Inappropriate Content
Re: Save Summaries for multiple graphs in one report using JSL
Yes, this code is the basis for a solution:
Names Default To Here( 1 );

dt = Open( 	"$SAMPLE_DATA/Big Class.jmp" );

obj = dt << Control Chart Builder( Variables( Y( :weight, :height ) ) );

dt = obj << Save Summaries;
Are you launching Control Chart Builder for more than one response at a time? If so, you should get a data table for each response. Are you iterating over the responses and launching Control Chart Builder for one response at a time?
- Mark as New
- Bookmark
- Subscribe
- Mute
- Subscribe to RSS Feed
- Get Direct Link
- Report Inappropriate Content
Re: Save Summaries for multiple graphs in one report using JSL
Hey @Mark_Bailey , I believe this here should give a better idea how my data is setup. I have adapted the Big Class dataset by adding this:
Names Default to Here( 1 );

dt = Open( "$SAMPLE_DATA/Big Class.jmp" );

New Window ("Charts",
For ( i = 1, i <= N Row(dt), i++,
	name = dt:Name[i];
	obj = dt << Control Chart Builder( Variables( Y( :height, :weight ) ), Show Control Panel( 0 ), SendToReport(
		Dispatch(
			{},
			"graph display 1 title",
			TextEditBox,
			{Set Text( name || " Individual & Moving Range chart of height" )}
		)
	) );
);	);

dt = obj << Save Summaries;
The 'new window' and 'for' potions were added to be reflective of what I am looking for. If the above is run, inside the "Charts" window is 40 graphs with all the same data. For the sake of what we are doing here, please assume that each graph would have different data, and because of that, different summaries. When 'Save Summaries' is run at the bottom of this, I do not get summaries for all of the graphs, just the last graph in the "Charts" window.
Is there any way for me to tell this code to pull the summaries of any of the graphs it ran? Like for example, if I want the summaries for the 35 graph in the "Charts" window, can I get that using JSL like the above example? or would I be able to just pull all of them somehow?
Please let me know if I can provide additional info. To answer you question from before, I believe what's happening is each instance is iterating over itself, so I am unable to save the variables summaries. Hopefully that helps, thank you for your help!
- Mark as New
- Bookmark
- Subscribe
- Mute
- Subscribe to RSS Feed
- Get Direct Link
- Report Inappropriate Content
Re: Save Summaries for multiple graphs in one report using JSL
Below are three suggestions in the order I would try them.
You could try scripting Make Combined Data table
Names Default To Here(1);

dt = Open("$SAMPLE_DATA/Big Class.jmp");

nw = New Window("Charts",
	For(i = 1, i <= N Row(dt), i++,
		name = dt:Name[i];
		obj = dt << Control Chart Builder(
			Variables(Y(:height, :weight)),
			Show Control Panel(0),
			SendToReport(
				Dispatch(
					{},
					"graph display 1 title",
					TextEditBox,
					{Set Text(name || " Individual & Moving Range chart of height")}
				)
			)
		);
	)
);

dt_summaries = nw["Control Chart Builder", "height Limit Summaries", Table Box(1)] << Make Combined Data Table;
Or you could store references to those control chart builders during loop and then loop again with Save Summaries (you should most likely save values inside the loop and then close the tables):
Names Default To Here(1);

dt = Open("$SAMPLE_DATA/Big Class.jmp");

ccb_list = {};

nw = New Window("Charts",
	For(i = 1, i <= N Row(dt), i++,
		name = dt:Name[i];
		obj = dt << Control Chart Builder(
			Variables(Y(:height, :weight)),
			Show Control Panel(0),
			SendToReport(
				Dispatch(
					{},
					"graph display 1 title",
					TextEditBox,
					{Set Text(name || " Individual & Moving Range chart of height")}
				)
			)
		);
		Insert Into(ccb_list, obj);
	);
);

For(i = 1, i <= N Items(ccb_list), i++,
	dt_temp = ccb_list[i] << Save Summaries;
	show(dt_temp);
	//Close(dt_temp, no save);
);
Or you can use XPath to get the references (and them I would again loop to avoid opening too many tables)
Names Default To Here(1);

dt = Open("$SAMPLE_DATA/Big Class.jmp");

nw = New Window("Charts",
	For(i = 1, i <= N Row(dt), i++,
		name = dt:Name[i];
		obj = dt << Control Chart Builder(
			Variables(Y(:height, :weight)),
			Show Control Panel(0),
			SendToReport(
				Dispatch(
					{},
					"graph display 1 title",
					TextEditBox,
					{Set Text(name || " Individual & Moving Range chart of height")}
				)
			)
		);
	);
);

//((nw << XPath("//OutlineBox[text()='Control Chart Builder']")) << get scriptable object) << Save Summaries;
If the << save summaries does open more than one table, you might have to use something like Get Data Table List(); to see which are the new ones, handle them and then close them.
- Mark as New
- Bookmark
- Subscribe
- Mute
- Subscribe to RSS Feed
- Get Direct Link
- Report Inappropriate Content
Re: Save Summaries for multiple graphs in one report using JSL
Thank you for this! I ended up using the second version you sent through and it was perfect for what I am doing.
Thanks!
Recommended Articles
- © 2026 JMP Statistical Discovery LLC. All Rights Reserved.
- Terms of Use
- Privacy Statement
- Contact Us