- Subscribe to RSS Feed
- Mark Topic as New
- Mark Topic as Read
- Float this Topic for Current User
- Bookmark
- Subscribe
- Mute
- Printer Friendly Page
Discussions
Solve problems, and share tips and tricks with other JMP users.- JMP User Community
- :
- Discussions
- :
- Re: Reverse colors in Contour Plot Platform
- Mark as New
- Bookmark
- Subscribe
- Mute
- Subscribe to RSS Feed
- Get Direct Link
- Report Inappropriate Content
Reverse colors in Contour Plot Platform
I have a script which iterates over several columns and generates contour plots.
If the column values are negative I want to reverse the contour colours, so I set a variable like this:
if(col mean( col1 ) < 0, revcols = 1, revcols = 0);
Contour Plot(
	...
	Reverse Colors( revcols ),
	...
However, the problem I have is that the contour plot is now always reversed - it seems to ignore the value of revcols.
If I hardcode
Reverse Colors( 0 )then it doesn't reverse the colours, but if revcols = 0 then it's reversed.
Do I need to do something clever to make it treat a variable with value 0 as zero in this case?
Thanks!
Accepted Solutions
- Mark as New
- Bookmark
- Subscribe
- Mute
- Subscribe to RSS Feed
- Get Direct Link
- Report Inappropriate Content
Re: Reverse colors in Contour Plot Platform
Here is a work around that works on my system
Clear Globals();
rev = 1;
Eval(
	Substitute(
			Expr(
				Contour Plot(
					X( :height, :weight ),
					Y( :age ),
					Show Data Points( 0 ),
					Fill Areas( 1 ),
					Label Contours( 0 ),
					__reverse__,
					Transform( "Range Normalized" ),
					Specify Contours( Min( 12.5 ), Max( 16.5 ), N( 9 ) ),
					SendToReport(
						Dispatch(
							{},
							"Contour Plot for age",
							OutlineBox,
							{Set Title( "Contour Plot for age, with rev = " || Char( rev) || " using substitute" )}
						)
					)
				)
			),
		Expr( __reverse__ ), If(rev==1,parse("Reverse Colors( 1 )"),parse("")))

);- Mark as New
- Bookmark
- Subscribe
- Mute
- Subscribe to RSS Feed
- Get Direct Link
- Report Inappropriate Content
Re: Reverse colors in Contour Plot Platform
I ran the script below in JMP 12 and JMP 15 and both of them worked without error. If you can supply more details, I might be able to get down to the issue.
rev=1;
Contour Plot(
	X( :height, :weight ),
	Y( :age ),
	Show Data Points( 0 ),
	Fill Areas( 0 ),
	Label Contours( 0 ),
	Reverse Colors( rev ),
	Transform( "Range Normalized" ),
	Specify Contours( Min( 12.5 ), Max( 16.5 ), N( 9 ) )
)
I used the Big Class sample data table for my testing.
- Mark as New
- Bookmark
- Subscribe
- Mute
- Subscribe to RSS Feed
- Get Direct Link
- Report Inappropriate Content
Re: Reverse colors in Contour Plot Platform
Thanks for your reply! I am using JMP 14.2.0 on MacOS 10.14.6.
I tried your script but I am still seeing the same problem. I added this to the script so I was sure I was getting the correct output:
SendToReport(
	Dispatch( {}, "Contour Plot for age", OutlineBox, {Set Title( "Contour Plot for age, with rev = " || Char( rev ) )} )
)
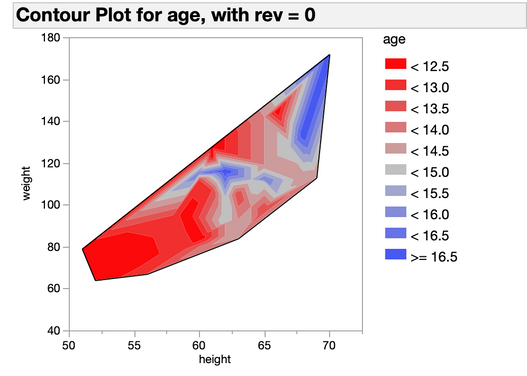
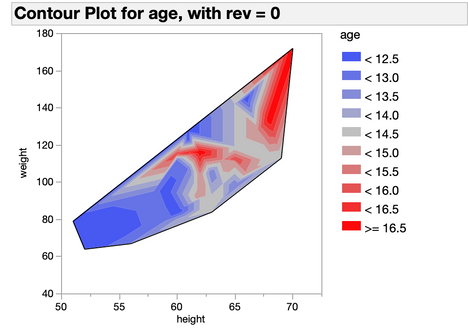
And the charts look like this (I also filled the contours to make it more obvious):
As before, if I hardcode in
Reverse Colors( 0 )Then I get this (which is correct):
Hope this helps. Thanks!
- Mark as New
- Bookmark
- Subscribe
- Mute
- Subscribe to RSS Feed
- Get Direct Link
- Report Inappropriate Content
Re: Reverse colors in Contour Plot Platform
Try converting your code to a Substitute structure, which will present to JMP the value of rev as if it is hard coded.
rev = 1;
Eval(
	Substitute(
			Expr(
				Contour Plot(
					X( :height, :weight ),
					Y( :age ),
					Show Data Points( 0 ),
					Fill Areas( 0 ),
					Label Contours( 0 ),
					Reverse Colors( __reverse__ ),
					Transform( "Range Normalized" ),
					Specify Contours( Min( 12.5 ), Max( 16.5 ), N( 9 ) )
				)
			),
		Expr( __reverse__ ), rev
	)
);- Mark as New
- Bookmark
- Subscribe
- Mute
- Subscribe to RSS Feed
- Get Direct Link
- Report Inappropriate Content
Re: Reverse colors in Contour Plot Platform
Thanks for the suggestion, but still no luck. I tried this:
// Code as run
Clear Globals();
rev = 0;
Eval(
	Substitute(
			Expr(
				Contour Plot(
					X( :height, :weight ),
					Y( :age ),
					Show Data Points( 0 ),
					Fill Areas( 1 ),
					Label Contours( 0 ),
					Reverse Colors( __reverse__ ),
					Transform( "Range Normalized" ),
					Specify Contours( Min( 12.5 ), Max( 16.5 ), N( 9 ) ),
					SendToReport(
						Dispatch(
							{},
							"Contour Plot for age",
							OutlineBox,
							{Set Title( "Contour Plot for age, with rev = " || Char( __reverse__ ) || " using substitute" )}
						)
					)
				)
			),
		Expr( __reverse__ ), rev
	)
);
However, the chart still came out with reversed colours. If I save the script from the chart, I get this:
// code from Save Script
Contour Plot(
	X( :height, :weight ),
	Y( :age ),
	Show Data Points( 0 ),
	Fill Areas( 1 ),
	Label Contours( 0 ),
	Reverse Colors( 1 ),
	Transform( "Range Normalized" ),
	Specify Contours( Min( 12.5 ), Max( 16.5 ), N( 9 ) ),
	SendToReport(
		Dispatch(
			{},
			"Contour Plot for age",
			OutlineBox,
			{Set Title( "Contour Plot for age, with rev = 0 using substitute" )}
		)
	)
);
As you can see, the value of __reverse__ has been correctly substituted into the title text, but for some reason I still get
Reverse Colors( 1 )Is this a bug and is there a workaround?
Thanks for your help!
- Mark as New
- Bookmark
- Subscribe
- Mute
- Subscribe to RSS Feed
- Get Direct Link
- Report Inappropriate Content
Re: Reverse colors in Contour Plot Platform
Here is a work around that works on my system
Clear Globals();
rev = 1;
Eval(
	Substitute(
			Expr(
				Contour Plot(
					X( :height, :weight ),
					Y( :age ),
					Show Data Points( 0 ),
					Fill Areas( 1 ),
					Label Contours( 0 ),
					__reverse__,
					Transform( "Range Normalized" ),
					Specify Contours( Min( 12.5 ), Max( 16.5 ), N( 9 ) ),
					SendToReport(
						Dispatch(
							{},
							"Contour Plot for age",
							OutlineBox,
							{Set Title( "Contour Plot for age, with rev = " || Char( rev) || " using substitute" )}
						)
					)
				)
			),
		Expr( __reverse__ ), If(rev==1,parse("Reverse Colors( 1 )"),parse("")))

);Recommended Articles
- © 2026 JMP Statistical Discovery LLC. All Rights Reserved.
- Terms of Use
- Privacy Statement
- Contact Us


