- Subscribe to RSS Feed
- Mark Topic as New
- Mark Topic as Read
- Float this Topic for Current User
- Bookmark
- Subscribe
- Mute
- Printer Friendly Page
Discussions
Solve problems, and share tips and tricks with other JMP users.- JMP User Community
- :
- Discussions
- :
- Re: Reorganizing a Table to Improve Graphing and Analysis
- Mark as New
- Bookmark
- Subscribe
- Mute
- Subscribe to RSS Feed
- Get Direct Link
- Report Inappropriate Content
Reorganizing a Table to Improve Graphing and Analysis
Hi all,
I have a legacy table which is full of data in JMP17. Currently it has columns which help identify the data (Temp, Conditions, DOM, etc). The values which we measured in this table include about 45 separate types of product and we will get a response for each of the 45 for each row. We have it set up right now to have that each of the 45 products has its own column for the value, however this limits me in how I can graph - for instance I cannot graph based off of each product or specific products. My first idea was to create a new column which has each product name but that is a ton of manual copy+paste and I want to avoid human error as this is important source data. How can I reorganize my data table to optimize the flexibility to graph without having to duplicate the hundreds of rows to condense one column (see below for example). I am open to any and all ideas! Thanks!
Example of original setup
vs
Proposed setup
Accepted Solutions
- Mark as New
- Bookmark
- Subscribe
- Mute
- Subscribe to RSS Feed
- Get Direct Link
- Report Inappropriate Content
Re: Reorganizing a Table to Improve Graphing and Analysis
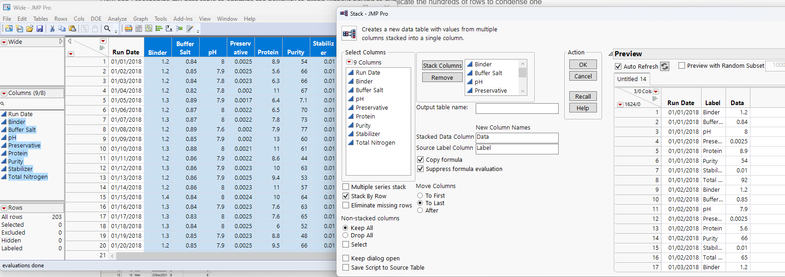
Have you tried the Tables...Stack command? That should allow you to make the change to your data structure in a new table for graphing, and won't require you to change the original data structure.
- Mark as New
- Bookmark
- Subscribe
- Mute
- Subscribe to RSS Feed
- Get Direct Link
- Report Inappropriate Content
Re: Reorganizing a Table to Improve Graphing and Analysis
Thank you this is Exactly what I need!!!
Jacob
Recommended Articles
- © 2026 JMP Statistical Discovery LLC. All Rights Reserved.
- Terms of Use
- Privacy Statement
- Contact Us


