- We’re retiring the File Exchange at the end of this year. The JMP Marketplace is now your destination for add-ins and extensions.
- JMP 19 is here! Learn more about the new features.
- Subscribe to RSS Feed
- Mark Topic as New
- Mark Topic as Read
- Float this Topic for Current User
- Bookmark
- Subscribe
- Mute
- Printer Friendly Page
Discussions
Solve problems, and share tips and tricks with other JMP users.- JMP User Community
- :
- Discussions
- :
- Re: Q: Life distribution for (real) life and interval censored data ; but mixed
- Mark as New
- Bookmark
- Subscribe
- Mute
- Subscribe to RSS Feed
- Get Direct Link
- Report Inappropriate Content
Q: Life distribution for (real) life and interval censored data ; but mixed
Hello,
I have both data of interval censored data and (real) end of life data.
For example, some sample died between 1000 and 1100 cycle, which is interval censored data with 100 cycle interval. (i.e., Dataset A)
For the other samples, since I've improved measurement method, I can get a exact life cycle of the sample, such as 1034th cycle. (i.e., Dataset B)
In this case, is it possible to plot life distribution with those types of data as one?
I obtain life distribution by censoring Dataset B with the interval of Dataset A (1034th cycle data -> 1000~1100 interval censored data).
However, since Dataset B is more accurate, I would like to fully use it, not censoring. Is there any way?
Accepted Solutions
- Mark as New
- Bookmark
- Subscribe
- Mute
- Subscribe to RSS Feed
- Get Direct Link
- Report Inappropriate Content
Re: Q: Life distribution for (real) life and interval censored data ; but mixed
Since you mentioned interval censored data, I think you should convert Dataset B to the Interval Censor format. I assume your Dataset A is already in Interval Censor format. Look at the following screenshot from sample data ICdevice02.
The Interval Censor formatted data has two time-to-event columns, HoursL and HoursU in the screenshot. In your case, the 1000-1100 observation should put 1000 in HoursL, and 1100 in HoursU. The 1034 cycle failure should put 1034 in HoursL AND 1034 in HoursU, which indicates a failure. If you have right censored observation, say 2000, then you put 2000 in HoursL and a missing values in HoursU. The above screenshot illustrates some of these cases, except the exact failure (the 1034).
After having both data in the same format, with the same column names. You then concatenate them into a single table, then launch Life Distribution.
When you launch the platform, put HoursL and HoursU both in Y. And don't forget the Freq column if you have one. Interval censoring usually comes with counts.
- Mark as New
- Bookmark
- Subscribe
- Mute
- Subscribe to RSS Feed
- Get Direct Link
- Report Inappropriate Content
Re: Q: Life distribution for (real) life and interval censored data ; but mixed
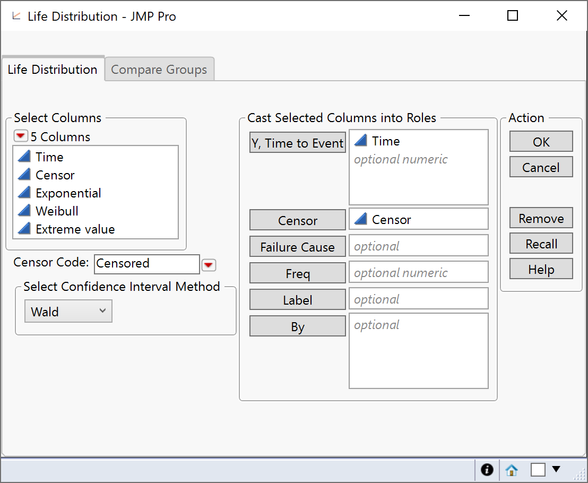
Yes you can, that is the purpose of the censor role in the analysis:
see for example, the table Fan.Jmp in the reliability section of sample data (Help>Sample Data Library, or Help>Sample Data>Reliability/Survival).
Your real data are uncensored - typically indicated with a 0 in the censor column of your data. Your other data is censored, typically indicated with a 1 in the censored column (this is the case in the sample data, although the column has a 'value labels' property associated with it).
So for your real failure times you would put the actual cycle time for the failure, marked as uncensored, and for the other values you would put the last known cycle time for which the product was known to operate (so for an interval of 1000-1100 this would be 1000, or I suppose maybe 999).
- Mark as New
- Bookmark
- Subscribe
- Mute
- Subscribe to RSS Feed
- Get Direct Link
- Report Inappropriate Content
Re: Q: Life distribution for (real) life and interval censored data ; but mixed
Since you mentioned interval censored data, I think you should convert Dataset B to the Interval Censor format. I assume your Dataset A is already in Interval Censor format. Look at the following screenshot from sample data ICdevice02.
The Interval Censor formatted data has two time-to-event columns, HoursL and HoursU in the screenshot. In your case, the 1000-1100 observation should put 1000 in HoursL, and 1100 in HoursU. The 1034 cycle failure should put 1034 in HoursL AND 1034 in HoursU, which indicates a failure. If you have right censored observation, say 2000, then you put 2000 in HoursL and a missing values in HoursU. The above screenshot illustrates some of these cases, except the exact failure (the 1034).
After having both data in the same format, with the same column names. You then concatenate them into a single table, then launch Life Distribution.
When you launch the platform, put HoursL and HoursU both in Y. And don't forget the Freq column if you have one. Interval censoring usually comes with counts.
- Mark as New
- Bookmark
- Subscribe
- Mute
- Subscribe to RSS Feed
- Get Direct Link
- Report Inappropriate Content
Re: Q: Life distribution for (real) life and interval censored data ; but mixed
Thank you for your help.
This is what I want. So I can use right, left, interval censored and exact data at once by constructing lower and upper hour row column.
Therefore, the exact data can be constructed as
HL HU Status Count
1034 1034 Exact 1(at most case)
Thank you!
Recommended Articles
- © 2025 JMP Statistical Discovery LLC. All Rights Reserved.
- Terms of Use
- Privacy Statement
- Contact Us


