- Subscribe to RSS Feed
- Mark Topic as New
- Mark Topic as Read
- Float this Topic for Current User
- Bookmark
- Subscribe
- Mute
- Printer Friendly Page
Discussions
Solve problems, and share tips and tricks with other JMP users.- JMP User Community
- :
- Discussions
- :
- Problem time axis settings graph builder
- Mark as New
- Bookmark
- Subscribe
- Mute
- Subscribe to RSS Feed
- Get Direct Link
- Report Inappropriate Content
Problem time axis settings graph builder
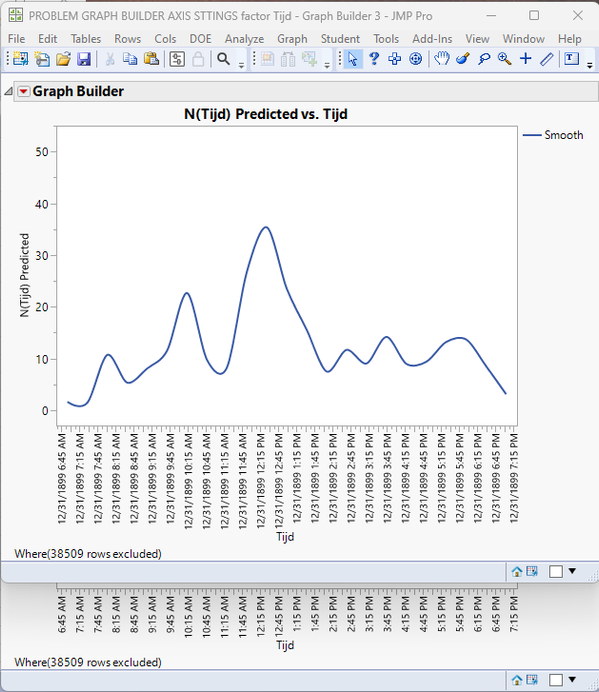
I have a problem with time axis settings in graph builder see file in attachment. When I use the full time axis scale for factor "Tijd" it is OK but adjusting axis settings to a more narrow "Tijd" scale I get a blank graph with increment time setting that don't correspond to my requested adjustments. Also (not shown), I can't concatenate this data set with another one, time/Tijd distribution goes wrong: I get a two line histogram. What is the problem with this time/Tijd factor? How to solve
- Mark as New
- Bookmark
- Subscribe
- Mute
- Subscribe to RSS Feed
- Get Direct Link
- Report Inappropriate Content
Re: Problem time axis settings graph builder
The JMP date/time values are based upon the number of seconds from the date midnight, January 1, 1904. The applying a format on a date/time column, does not change the underlying numerical value. Below I have taken the graph where you have not restricted the X axis range, and just changed the format being displayed and overlapped it with the original axis.
The axis shows a range that covers only the day of December 31, 1899. On your second graph, somehow the axis range has been set across a date range starting beyond any date/time in you data, December 31, 1899 10:44:14 AM to January 1, 1904 12:00:00.
My guess is that this is happening by setting the Minimum and Maximum with just the time part of the date/time column. I suggest that you change your format to a date/time format, set the range, and then change the format to your desired time only format.
- Mark as New
- Bookmark
- Subscribe
- Mute
- Subscribe to RSS Feed
- Get Direct Link
- Report Inappropriate Content
Re: Problem time axis settings graph builder
Your "more narrow "Tijd" scale" is actually a wider scale...a lot wider. And this new scale does not include the data. That's why the data are not visible in your "new/" one.
Your original, then new (and the new scale is reversed).

- Mark as New
- Bookmark
- Subscribe
- Mute
- Subscribe to RSS Feed
- Get Direct Link
- Report Inappropriate Content
Re: Problem time axis settings graph builder
Sorry, not yet a solution: when I narrow time scale as below
I Get a blank graph with a correct time scale and increment..
- Mark as New
- Bookmark
- Subscribe
- Mute
- Subscribe to RSS Feed
- Get Direct Link
- Report Inappropriate Content
Re: Problem time axis settings graph builder
Change the format from "h:m:s" to "m/d/y h:m:s" and I believe you will see that the "m/d/y" component of the date/time column is outside of the range of the data you have in your data table. All of your data has an m/d/y of 12/31/1899.
- Mark as New
- Bookmark
- Subscribe
- Mute
- Subscribe to RSS Feed
- Get Direct Link
- Report Inappropriate Content
Re: Problem time axis settings graph builder
Thanks Jim, I see , something must have gone wrong during data processing. Date (datum column) is OK, no idea where that 1899 comes from (??) Guess no solution to link with 1918 dates in datum column and start all over again..
Recommended Articles
- © 2026 JMP Statistical Discovery LLC. All Rights Reserved.
- Terms of Use
- Privacy Statement
- Contact Us


