- Image to Table JMP extension imports single or batch images as data tables. Useful to extract curves from pictures or convert image data to curve data to use in analyses like Functional Data Explorer. Download and install the extension.
- Subscribe to RSS Feed
- Mark Topic as New
- Mark Topic as Read
- Float this Topic for Current User
- Bookmark
- Subscribe
- Mute
- Printer Friendly Page
Discussions
Solve problems, and share tips and tricks with other JMP users.- User Community
- :
- Discussions
- :
- Re: Problem Graph builder second Y axis

- Mark as New
- Bookmark
- Subscribe
- Mute
- Subscribe to RSS Feed
- Get Direct Link
- Report Inappropriate Content
Problem Graph builder second Y axis
Hello Community,
I'm having trouble trying to create a second Y axis for a bar chart representation. I already followed the procedure explained in other discussions (select Y variables and move right), but the results for the case of bar charts are not good. Please see the picture below and you'll see that the variable I moved right is either behind or in front of the bars from the left Y axis, but I need them to be next to each other.
Could you help me in solving this ?
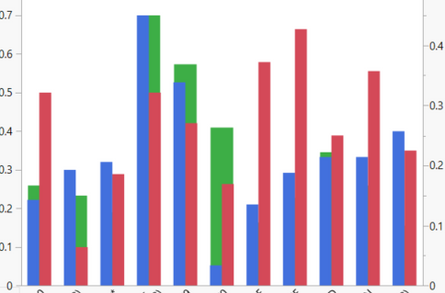
Thanks for reading.
Julian


- Mark as New
- Bookmark
- Subscribe
- Mute
- Subscribe to RSS Feed
- Get Direct Link
- Report Inappropriate Content
Re: Problem Graph builder second Y axis
You can get the separation if you use an Overlay column. If that Overlay column follows the left and right specification, you will get the bars fully displayed.
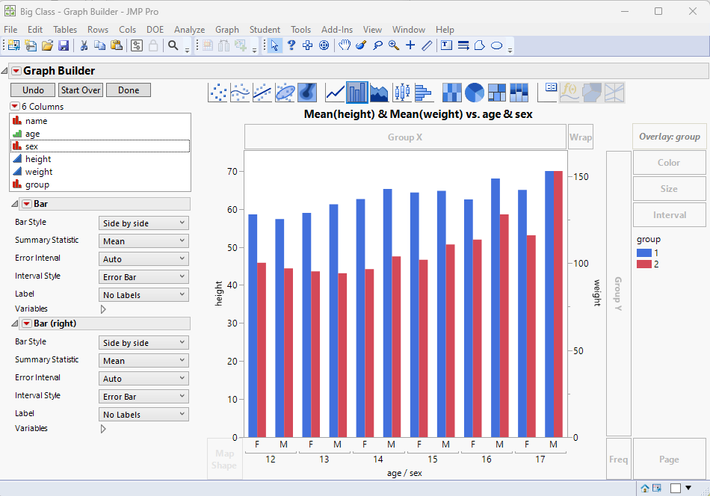
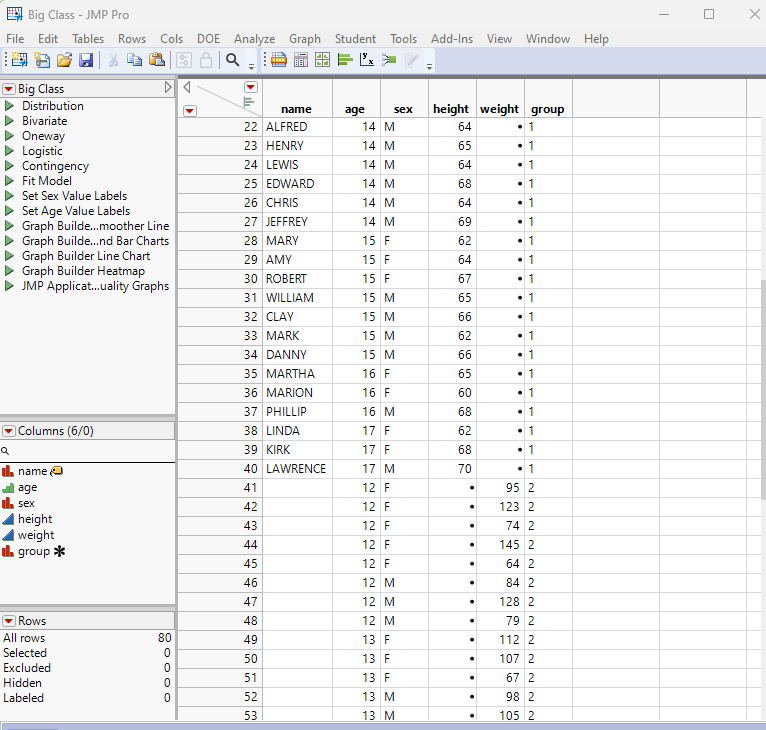
The above chart required the data table to be modified. The Height and Weight need to be identified by an overlay column. The way I do this, is to copy all of the Weight data into new rows, and to set all of the Weight data in the original rows to missing. Then I added a new column called Group which has the value 1 for the original rows, and a 2 for the new rows.


- Mark as New
- Bookmark
- Subscribe
- Mute
- Subscribe to RSS Feed
- Get Direct Link
- Report Inappropriate Content
Re: Problem Graph builder second Y axis
Hi @Julianveda ,
I like Jim's answer, but if you are looking for a graph that looks like this instead ...
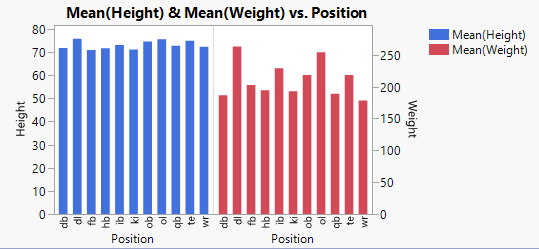
... you need to drag the Position variable onto the X axis twice.
I hope this helps,
~John
Here's the script for the graph above.
Open( "$SAMPLE_DATA/Football.jmp" ) <<
Graph Builder(
	Size( 413, 246 ),
	Show Control Panel( 0 ),
	Variables(
		X( :Position ),
		X( :Position ),
		Y( :Weight, Side( "Right" ) ),
		Y( :Height, Position( 1 ) )
	),
	Elements( Position( 1, 1 ), Bar( X, Y( 2 ), Legend( 70 ) ) ),
	Elements( Position( 2, 1 ), Bar( X, Y( 1 ), Legend( 73 ) ) ),
	SendToReport(
		Dispatch( {}, "Weight", ScaleBox,
			{Min( 0 ), Max( 296.774225863422 ), Inc( 50 ), Minor Ticks( 0 )
			}
		),
		Dispatch( {}, "graph title", TextEditBox,
			{Set Text( "Mean(Height) & Mean(Weight) vs. Position" )}
		)
	)
)
Recommended Articles
- © 2026 JMP Statistical Discovery LLC. All Rights Reserved.
- Terms of Use
- Privacy Statement
- Contact Us